Time Series
Sarah Heidmann
9/10/2020
Trophic Groups
Density
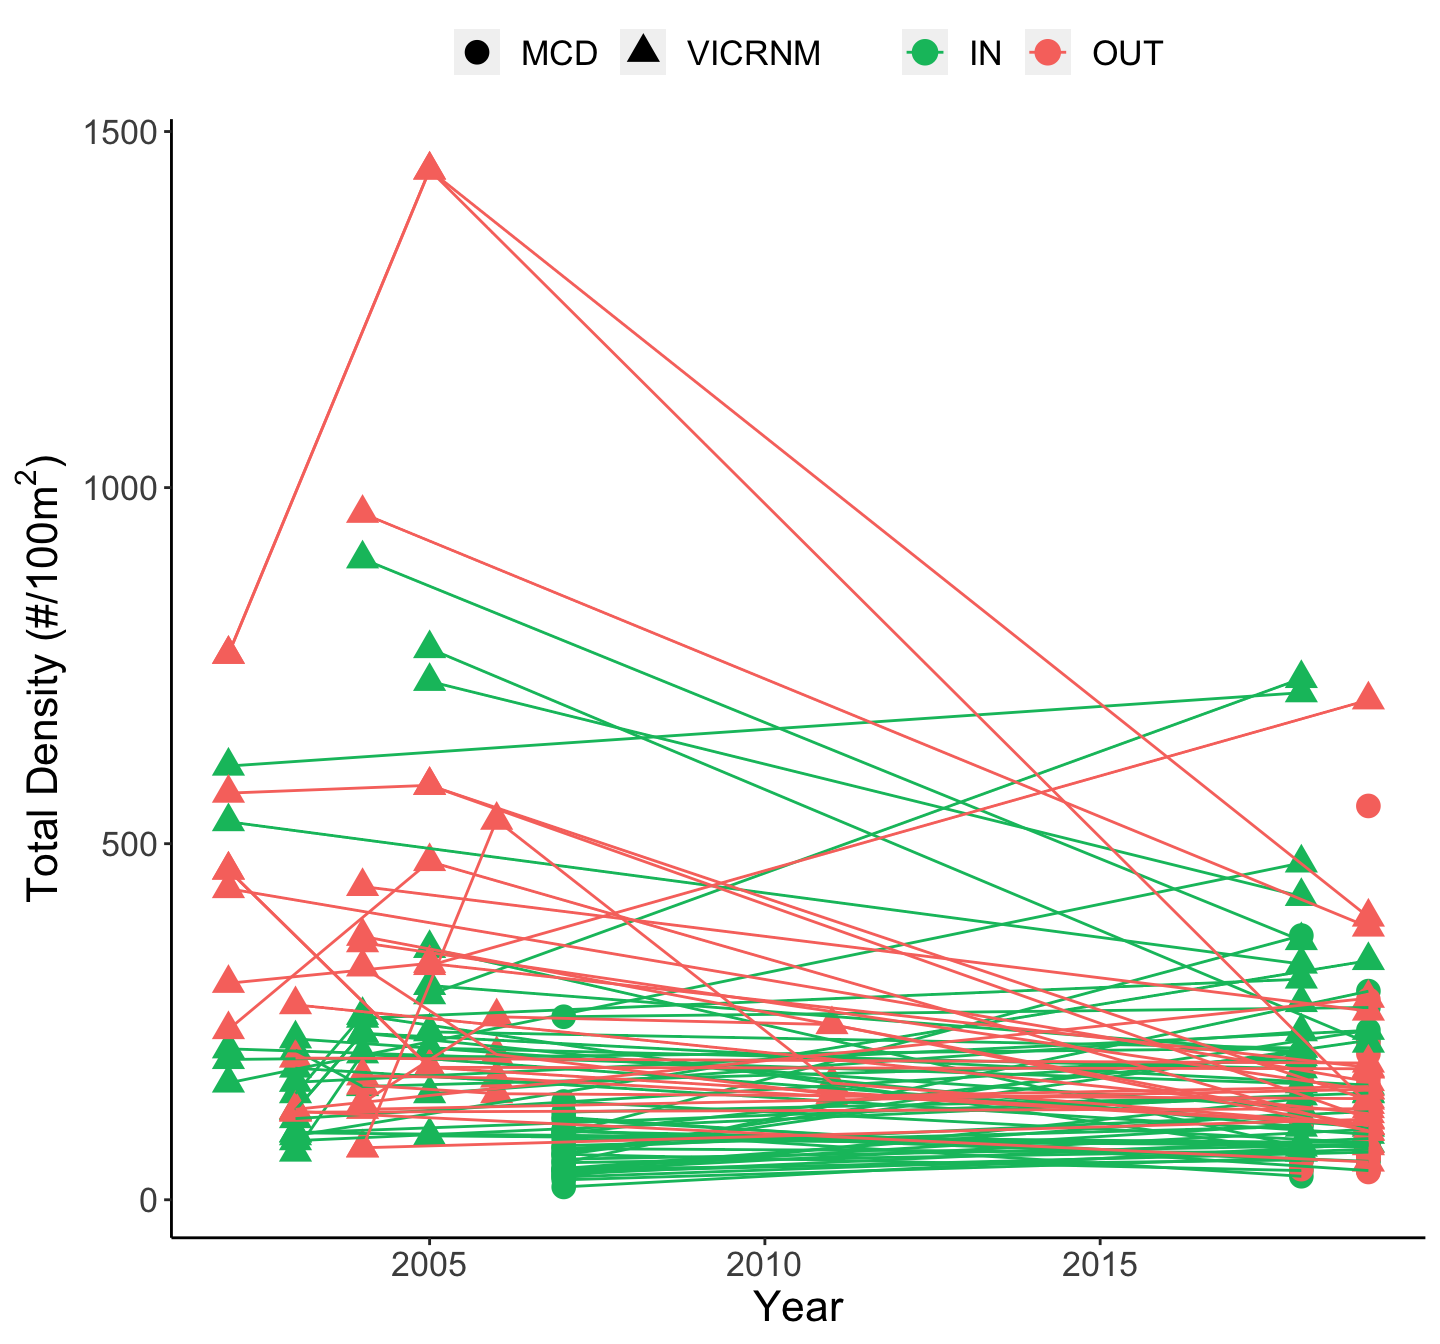
Density of all fish at sites over time. Lines connect the same site over time. Shape indicates the MPA in which the site was located, and color indicates whether the site was inside or outside the MPA.
Historic surveying of VICRNM sites occurred over a period of 5 years, with sites surveyed 1-3 times, and a few sites being additionally resurveyed in 2011. Due to the inconsistency in survey repetition across sites, surveys occurring 2003-2007 were considered “historic”, and surveys occuring 2018-2019 were considered “modern”.
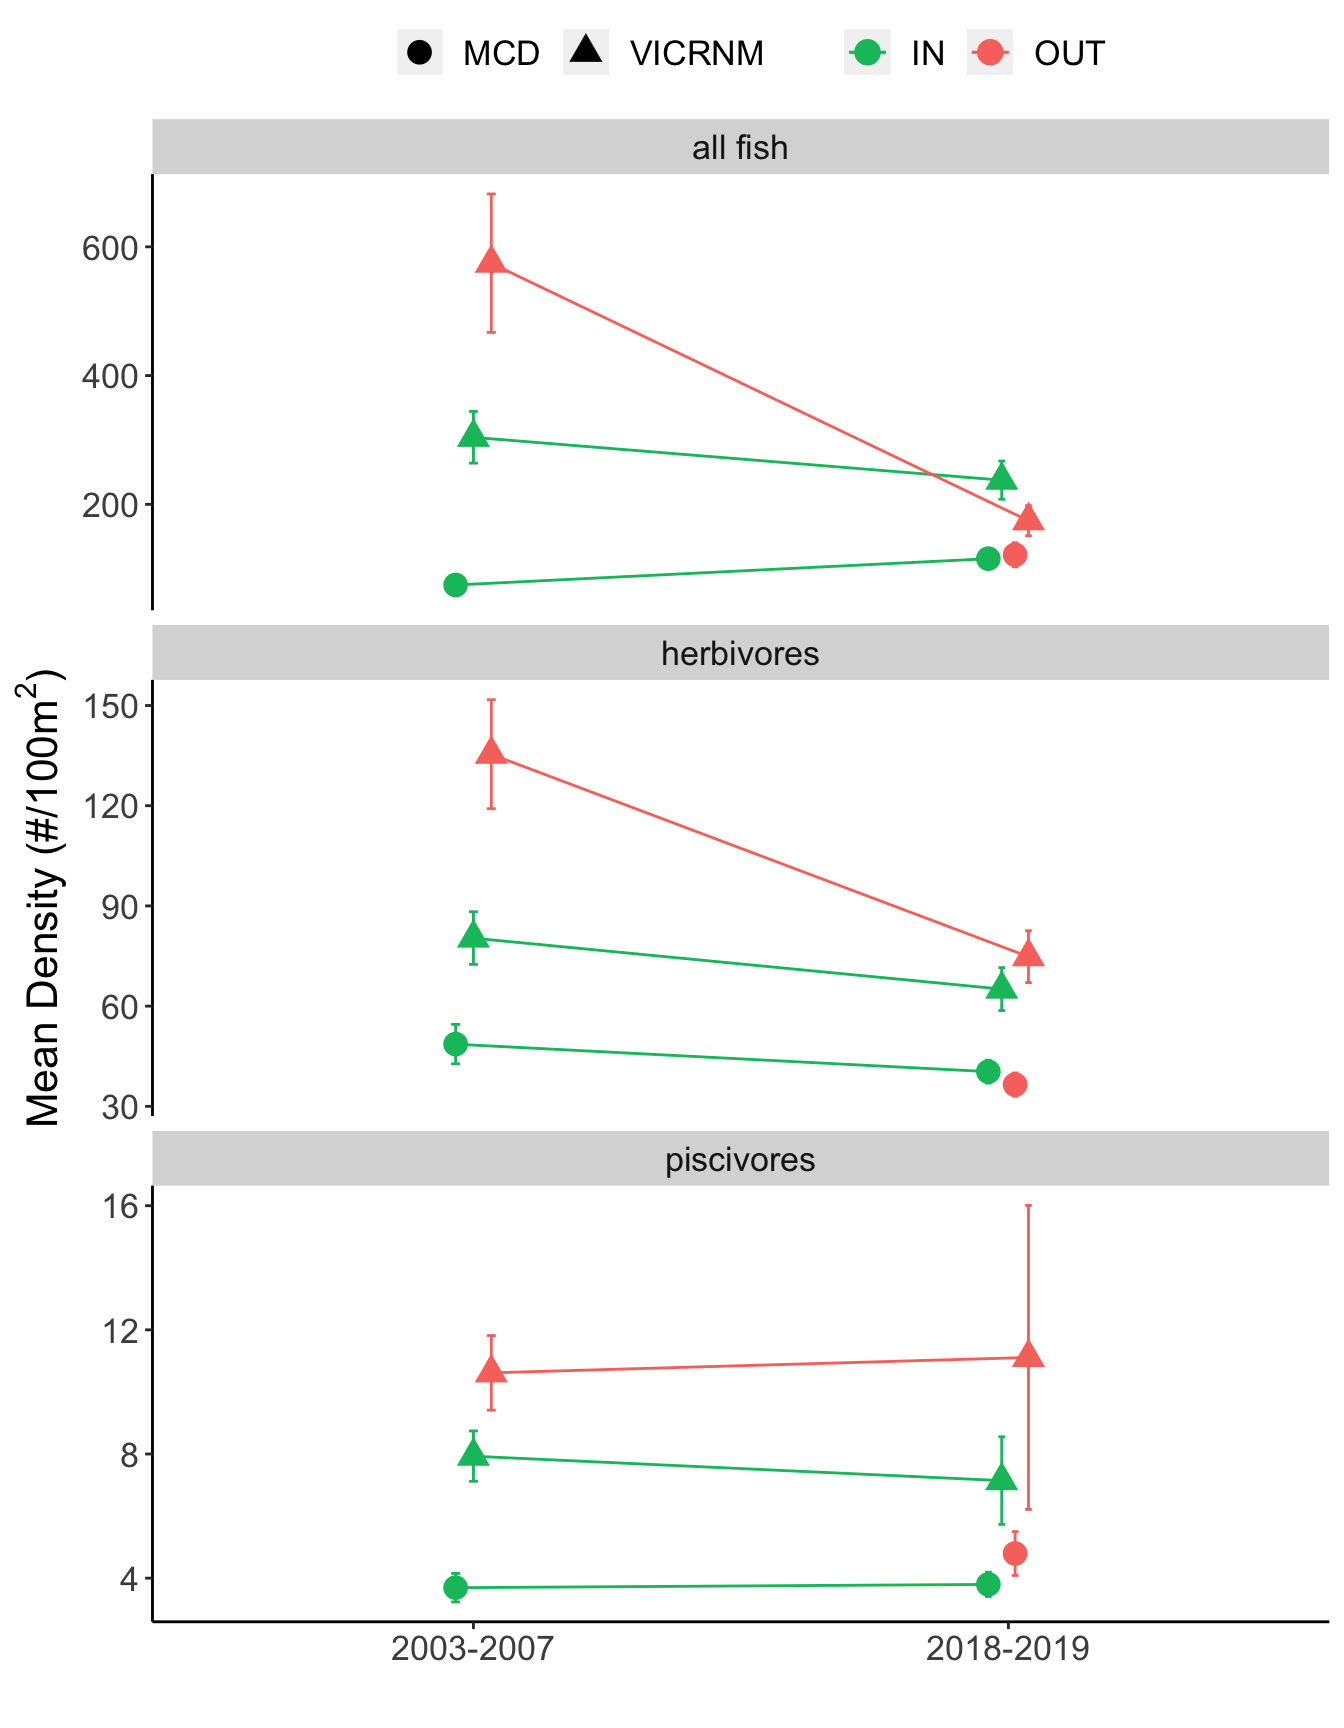
Mean density of trophic groups at sites over time. Shape indicates the MPA in which the site was located, and color indicates whether the site was inside or outside the MPA. Error bars represent mean ± SE.
Mean density of trophic groups at most locations stayed fairly steady over time. Gobies were removed from these numbers, as large numbers of masked gobies were recorded in historic VICRNM surveys. The most notable change occured outside the VICRNM, with a sharp decrease in total fish density between historic and modern sampling. Upon closer examination, this change was due to a historic presence of large schools of fish at many sites, from species such as bluehead wrasse, creole wrasse, blue chromis, and boga, that did not occur as often during modern surveys. There was also a notable decrease in herbivores outside the VICRNM over time. The large error bar for piscivores in modern surveys outside the VICRNM is heavily influenced by the presence of a large school of horse-eye jack at a single site.
Biomass
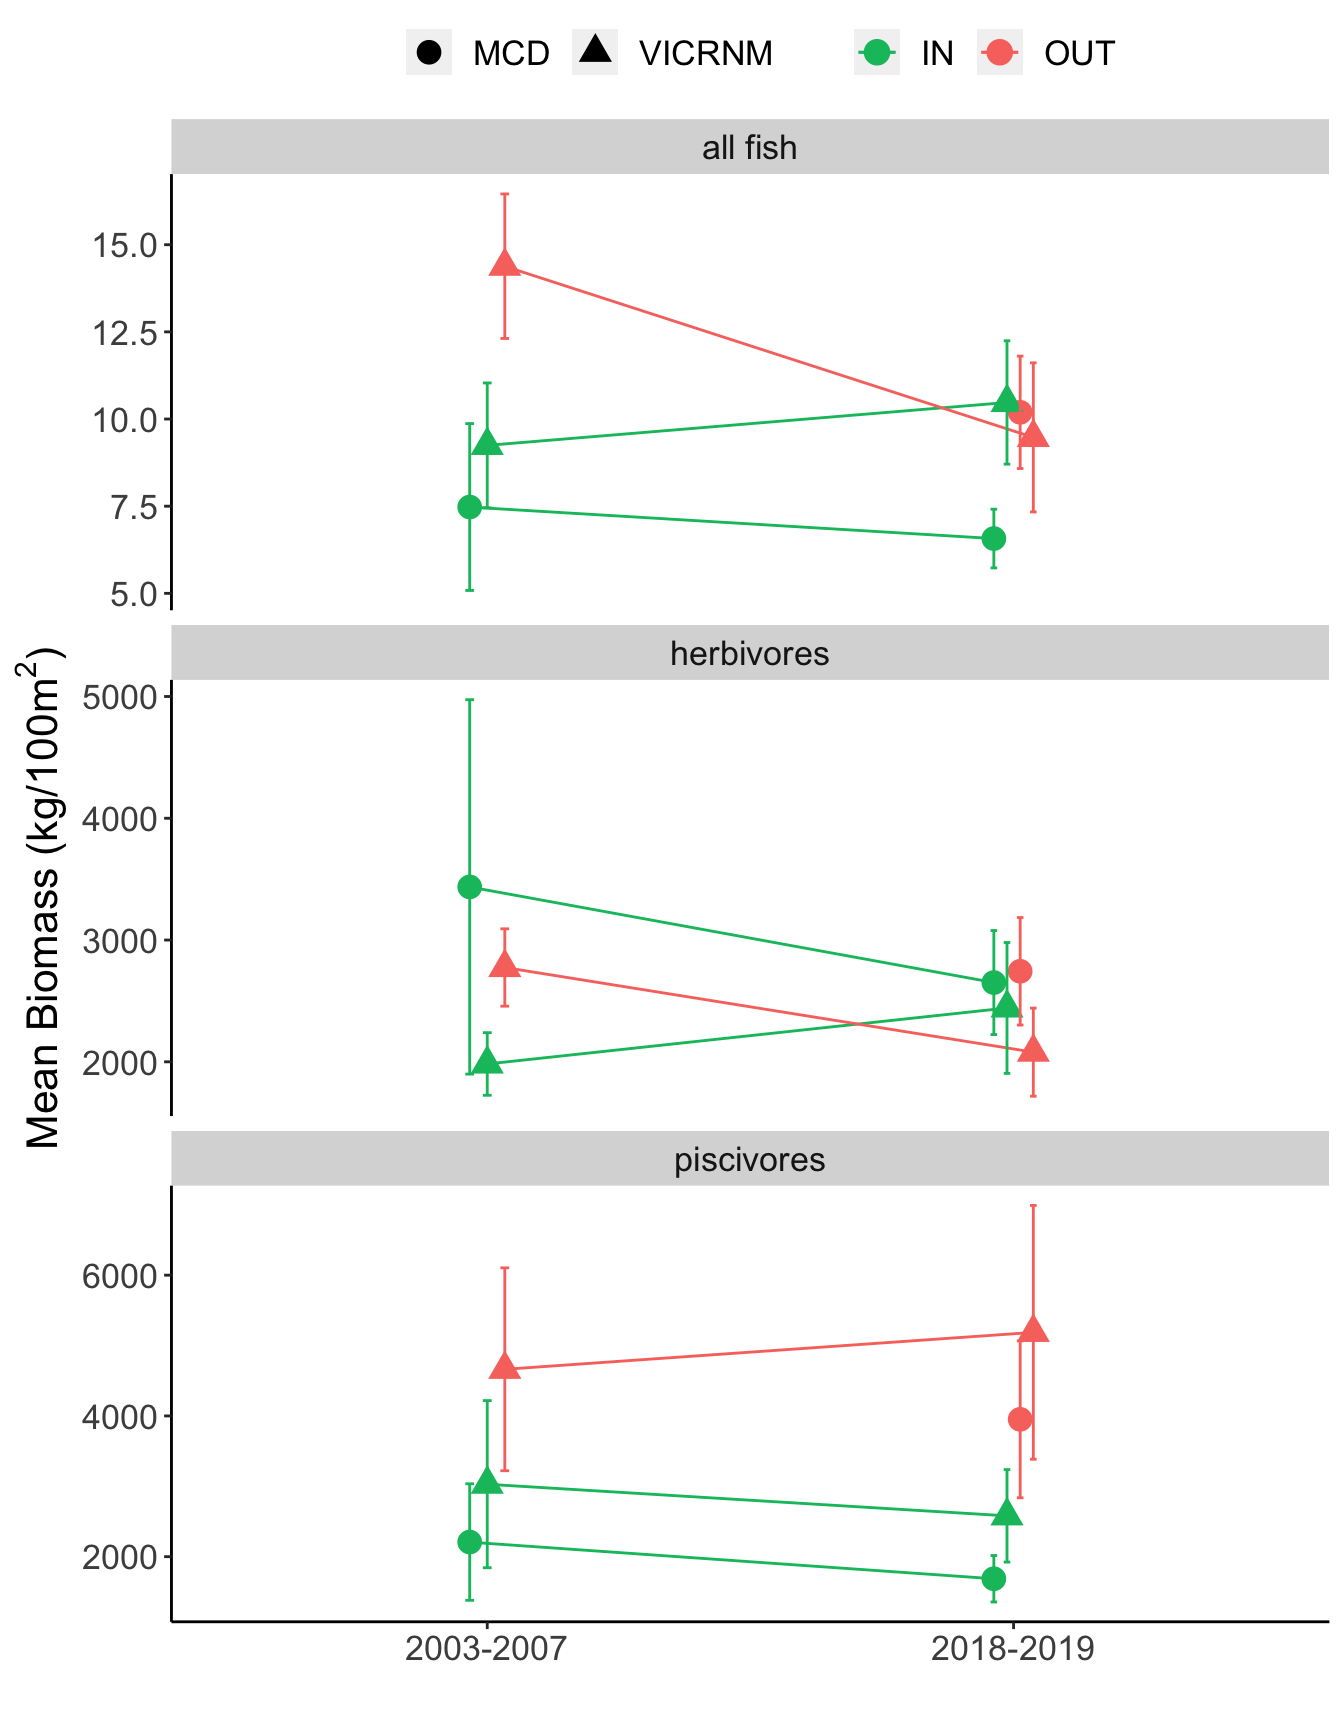
Mean biomass of trophic groups at sites over time. Shape indicates the MPA in which the site was located, and color indicates whether the site was inside or outside the MPA. Error bars represent mean ± SE.
There was high variation in biomass of trophic groups, such that there are no apparent trends in fish biomass over time, with the exception of the decrease in total biomass outside the VICRNM, due to the schools of fish that influenced the decrease in density.
Groups of Interest
Density
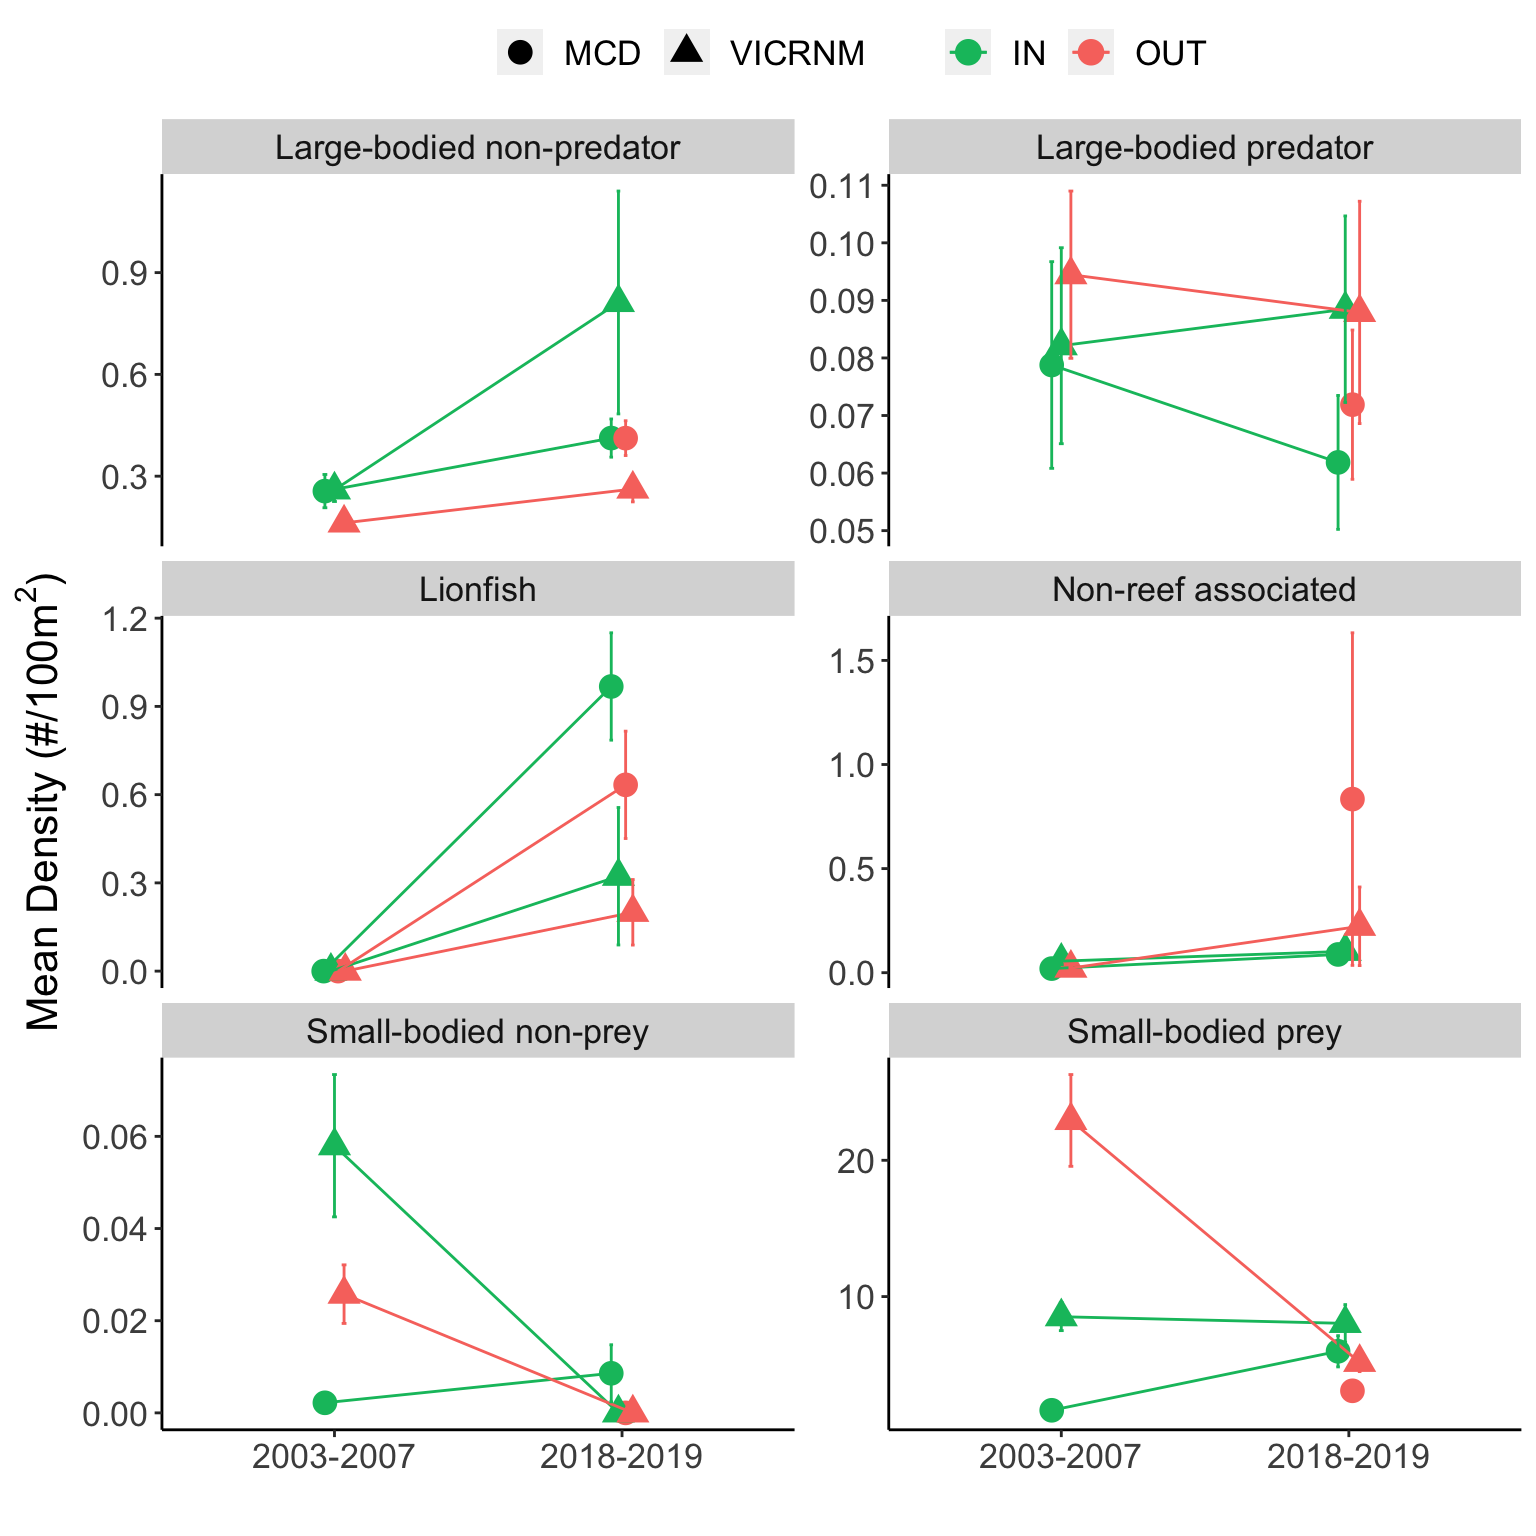
Mean fish density (#/100m2) of groups of interest, summarized by time period, MPA, and inside/outside MPA boundaries. Error bars represent mean ± SE. Shape represents the MPA in which the site was located, and color represents whether it was inside or outside MPA boundaries.
Biomass
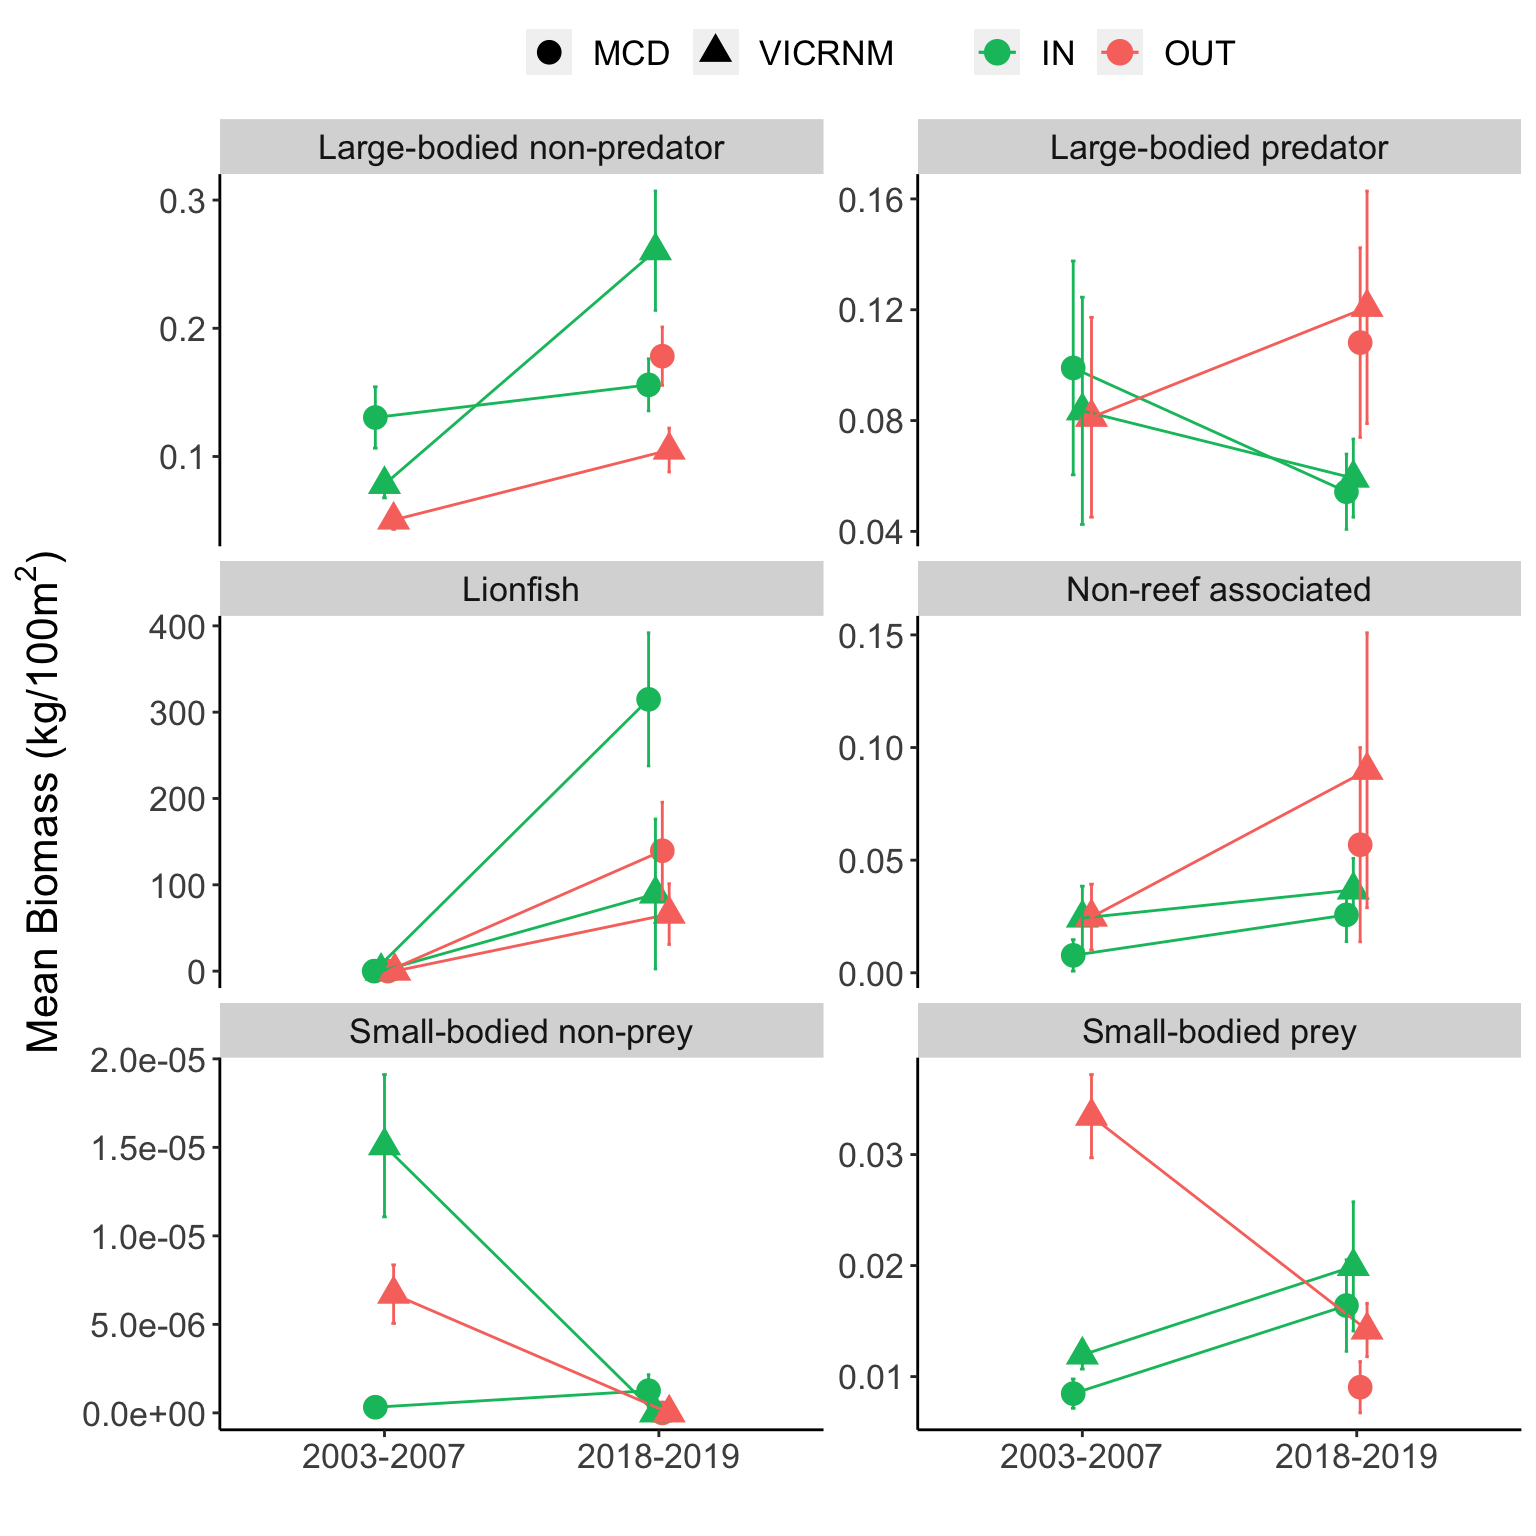
Mean fish biomass (kg/100m2) of groups of interest, summarized by time period, MPA, and inside/outside MPA boundaries. Error bars represent mean ± SE. Shape represents the MPA in which the site was located, and color represents whether it was inside or outside MPA boundaries.
No lionfish were observed during historic surveys, which was the most notable pattern over time. Large-bodied non-predators increased over time, while large-bodied predators had a less clear pattern. Small-bodied prey and non-prey both decreased over time outside the VICRNM, and non-prey also decreased inside the VICRNM. This change is most likely due to differences in diver recording rather than an ecological change, with modern surveys being more likely to ignore gobies. The largest contributors to small-bodied density were masked gobies, small bluehead wrasse, and blue chromis, while the largest contributors to small-bodied biomass were creole wrasse, boga, and blue chromis.
Indicator Species
Density
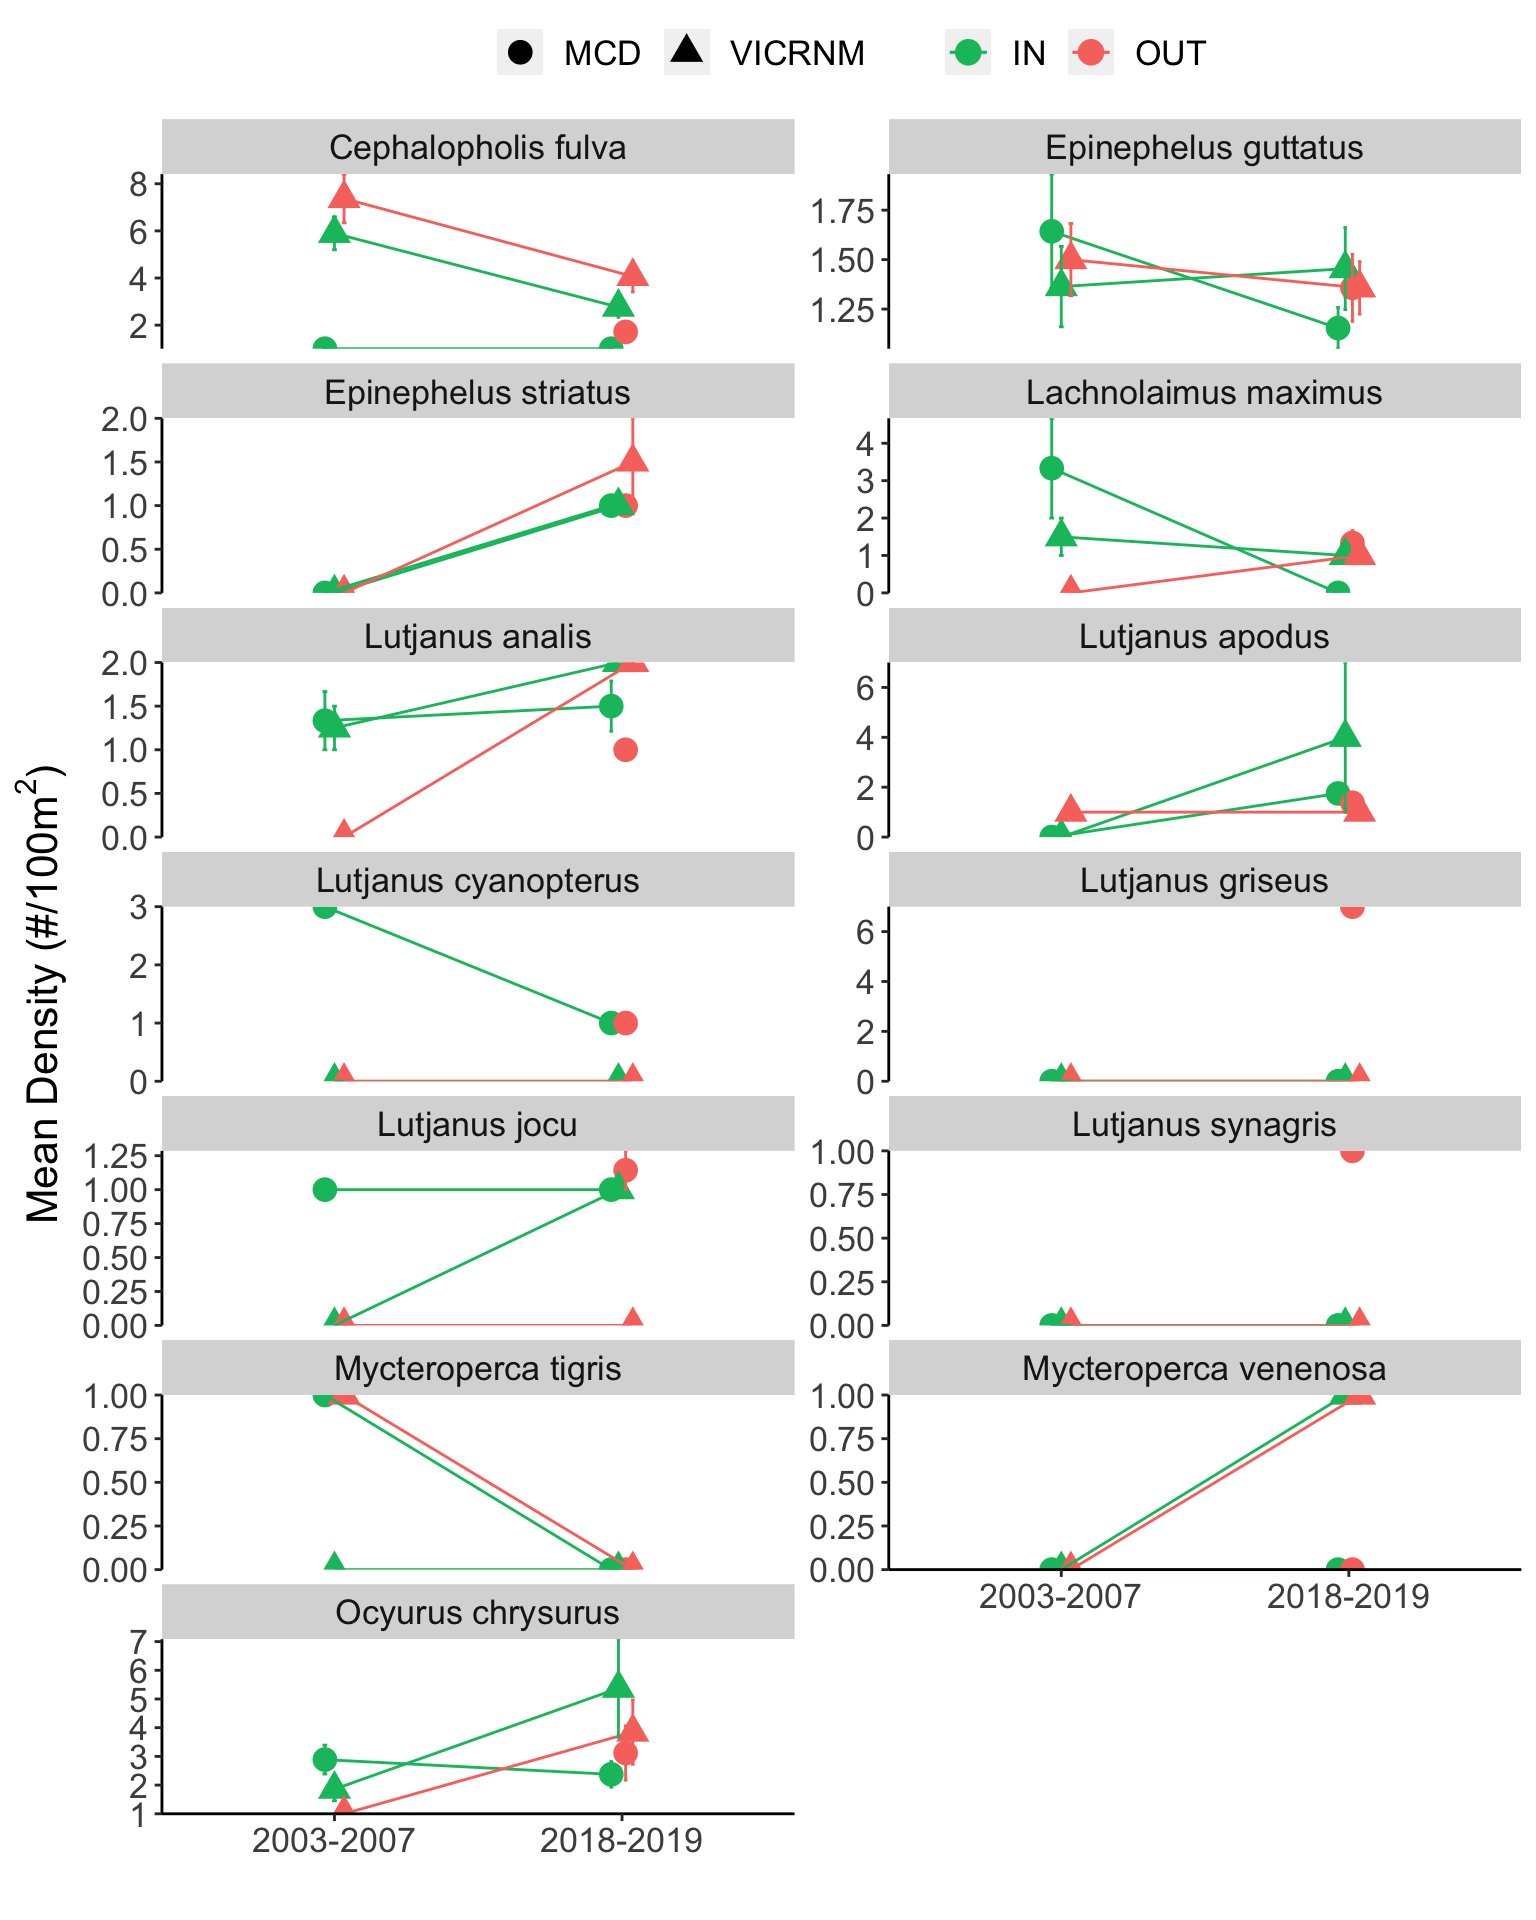
Mean density (#/100m2) of indicator species, summarized by time period, MPA, and inside/outside MPA boundaries. Error bars represent mean ± SE. Shape represents the MPA in which the site was located, and color represents whether it was inside or outside MPA boundaries.
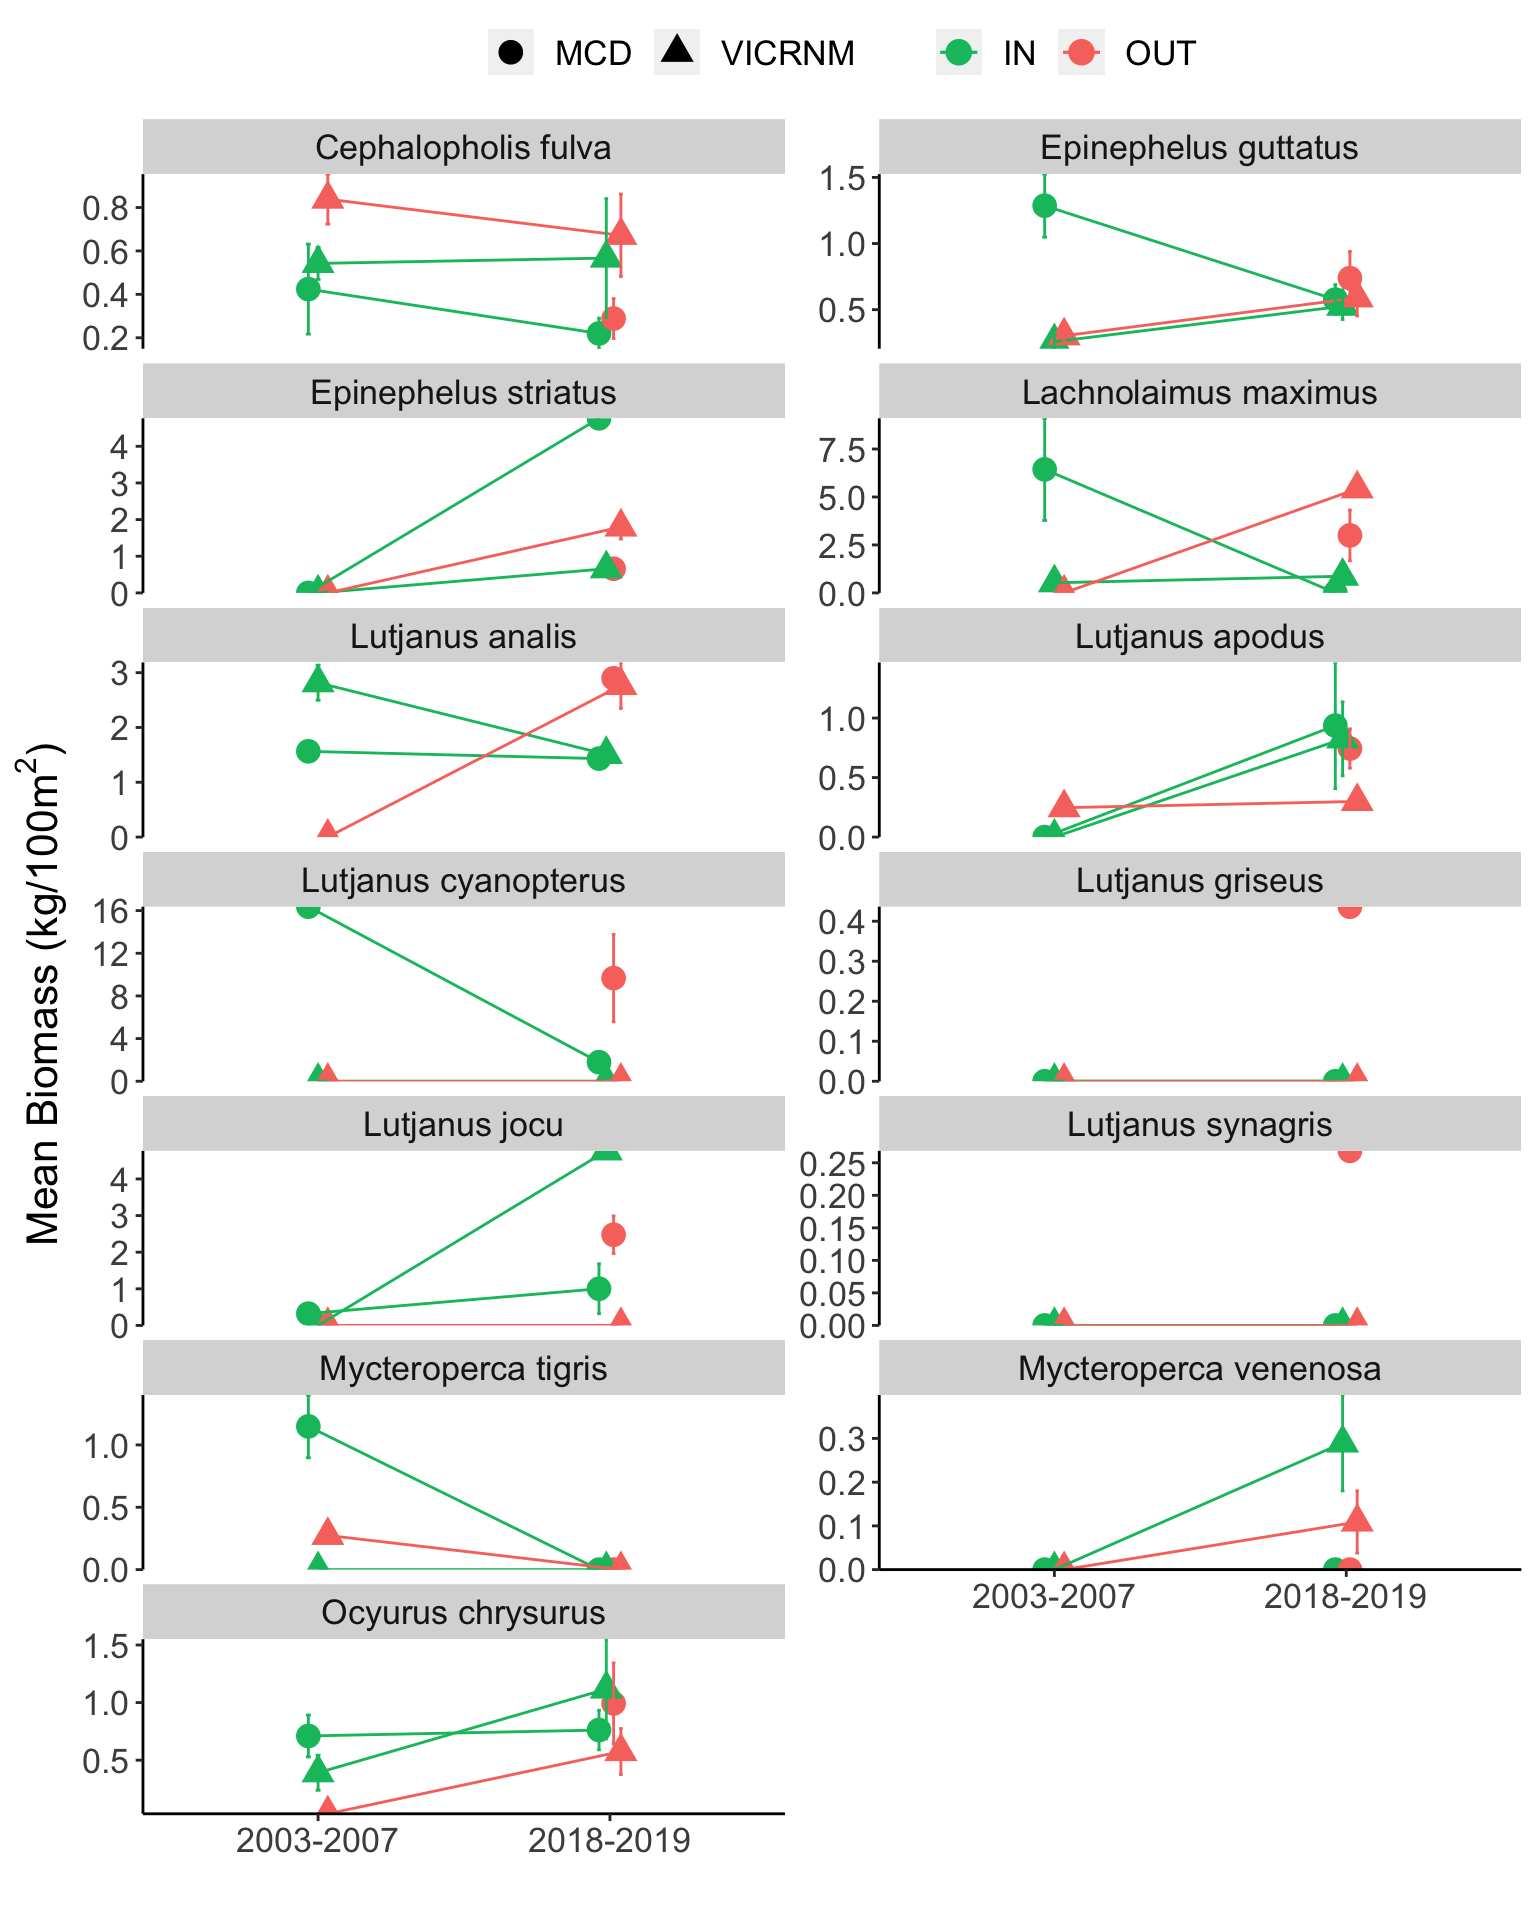
Mean biomass (kg/100m2) of indicator species, summarized by time period, MPA, and inside/outside MPA boundaries. Error bars represent mean ± SE. Shape represents the MPA in which the site was located, and color represents whether it was inside or outside MPA boundaries.