Lionfish
Sarah Heidmann
9/9/2020
Summary
This document examines patterns in the density and biomass of the invasive lionfish, Pterois volitans. Here we look at presence and size distributions inside and outside the boundaries of the Hind Bank Marine Conservation District (MCD) and Virgin Islands Coral Reef National Monument (VICRNM), and density and biomass of lionfish as compared to that of native prey and predators.
Size Frequency

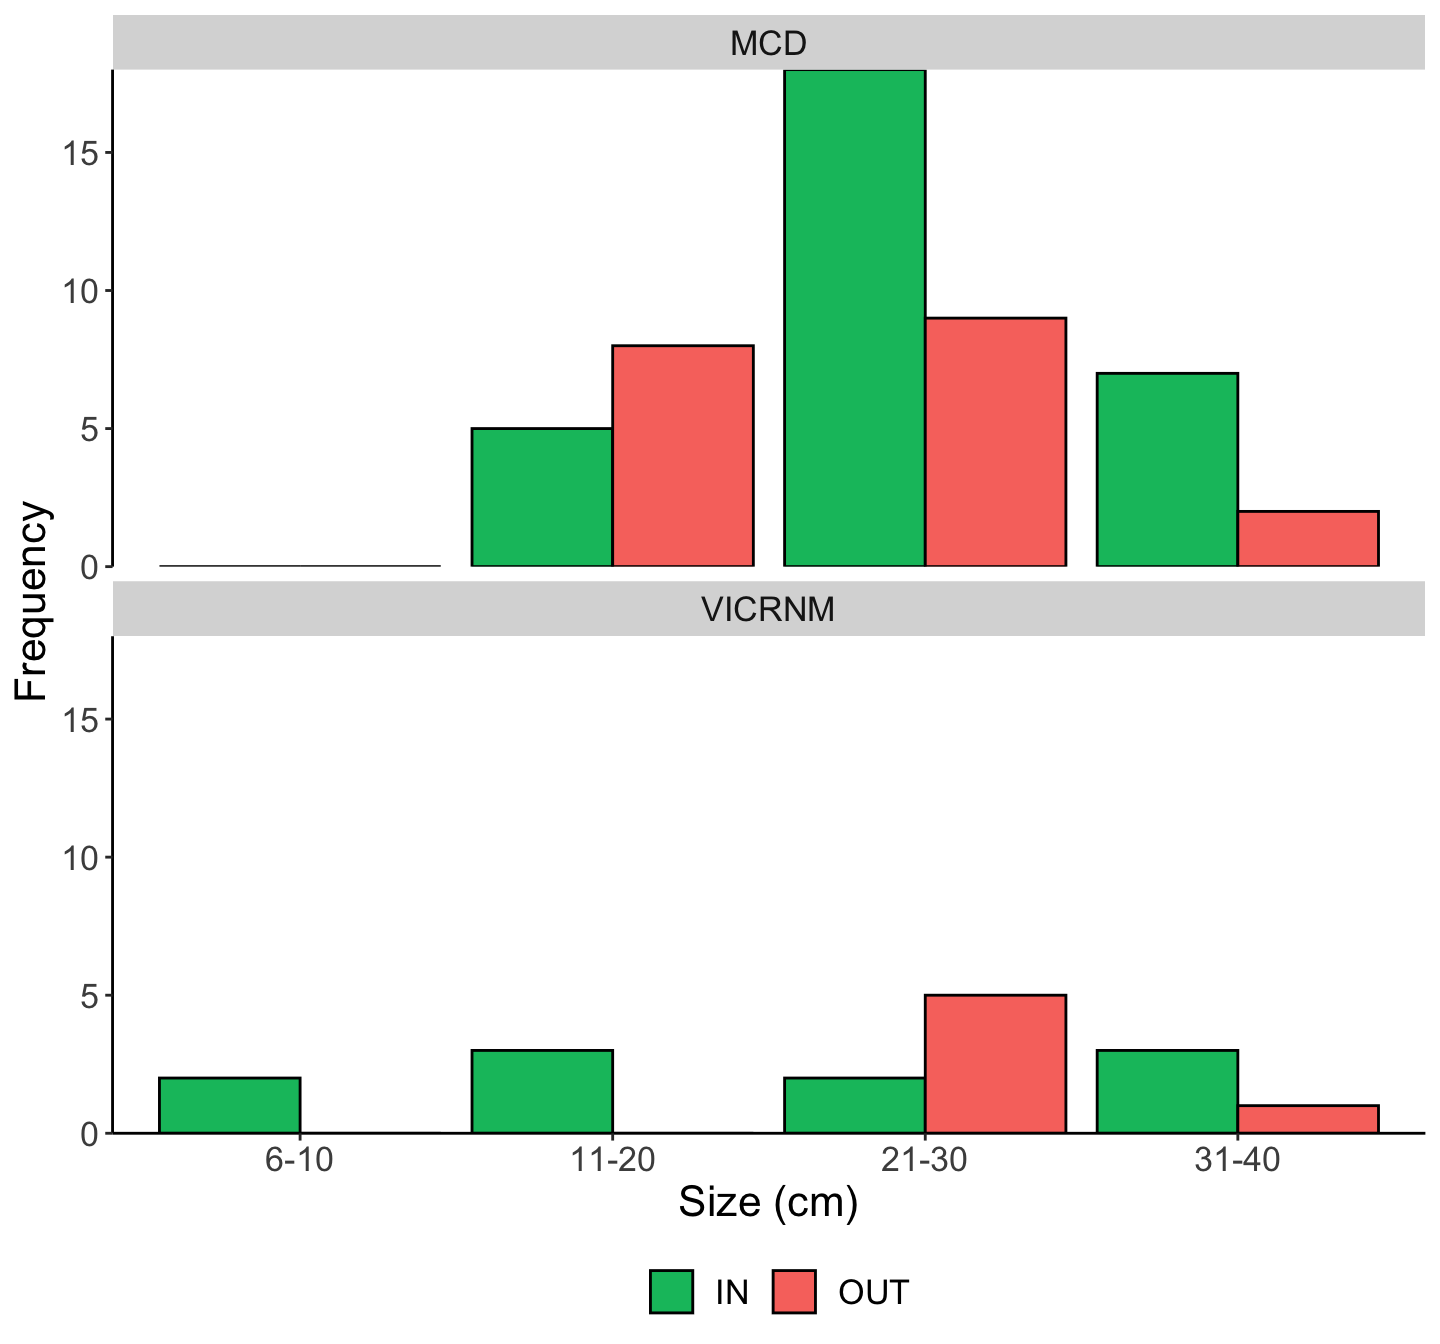
Size frequency distribution of lionfish, separated by MPA and inside/outside MPA boundaries.
##
## Call:
## lm(formula = size ~ MPA * InOut, data = lionsize)
##
## Residuals:
##      Min       1Q   Median       3Q      Max
## -14.0000  -6.5000  -0.6667   3.1579  13.5000
##
## Coefficients:
##                    Estimate Std. Error t value Pr(>|t|)
## (Intercept)          26.667      1.316  20.259   <2e-16 ***
## MPAVICRNM            -4.167      2.633  -1.583   0.1186
## InOutOUT             -3.825      2.114  -1.809   0.0753 .
## MPAVICRNM:InOutOUT    8.991      4.281   2.100   0.0399 *
## ---
## Signif. codes:  0 '***' 0.001 '**' 0.01 '*' 0.05 '.' 0.1 ' ' 1
##
## Residual standard error: 7.209 on 61 degrees of freedom
## Multiple R-squared:  0.08034,    Adjusted R-squared:  0.03511
## F-statistic: 1.776 on 3 and 61 DF,  p-value: 0.1611
Lionfish were most abundant in the 20-30 cm size class. There was no evidence that lionfish were differently sized between the MCD and the VICRNM, but there was suggestive evidence that lionfish were larger inside MPAs than outside (p = 0.08), and there was a significant interaction between MPA and inside/outside (p = 0.04).
Depth Patterns
Size with Depth

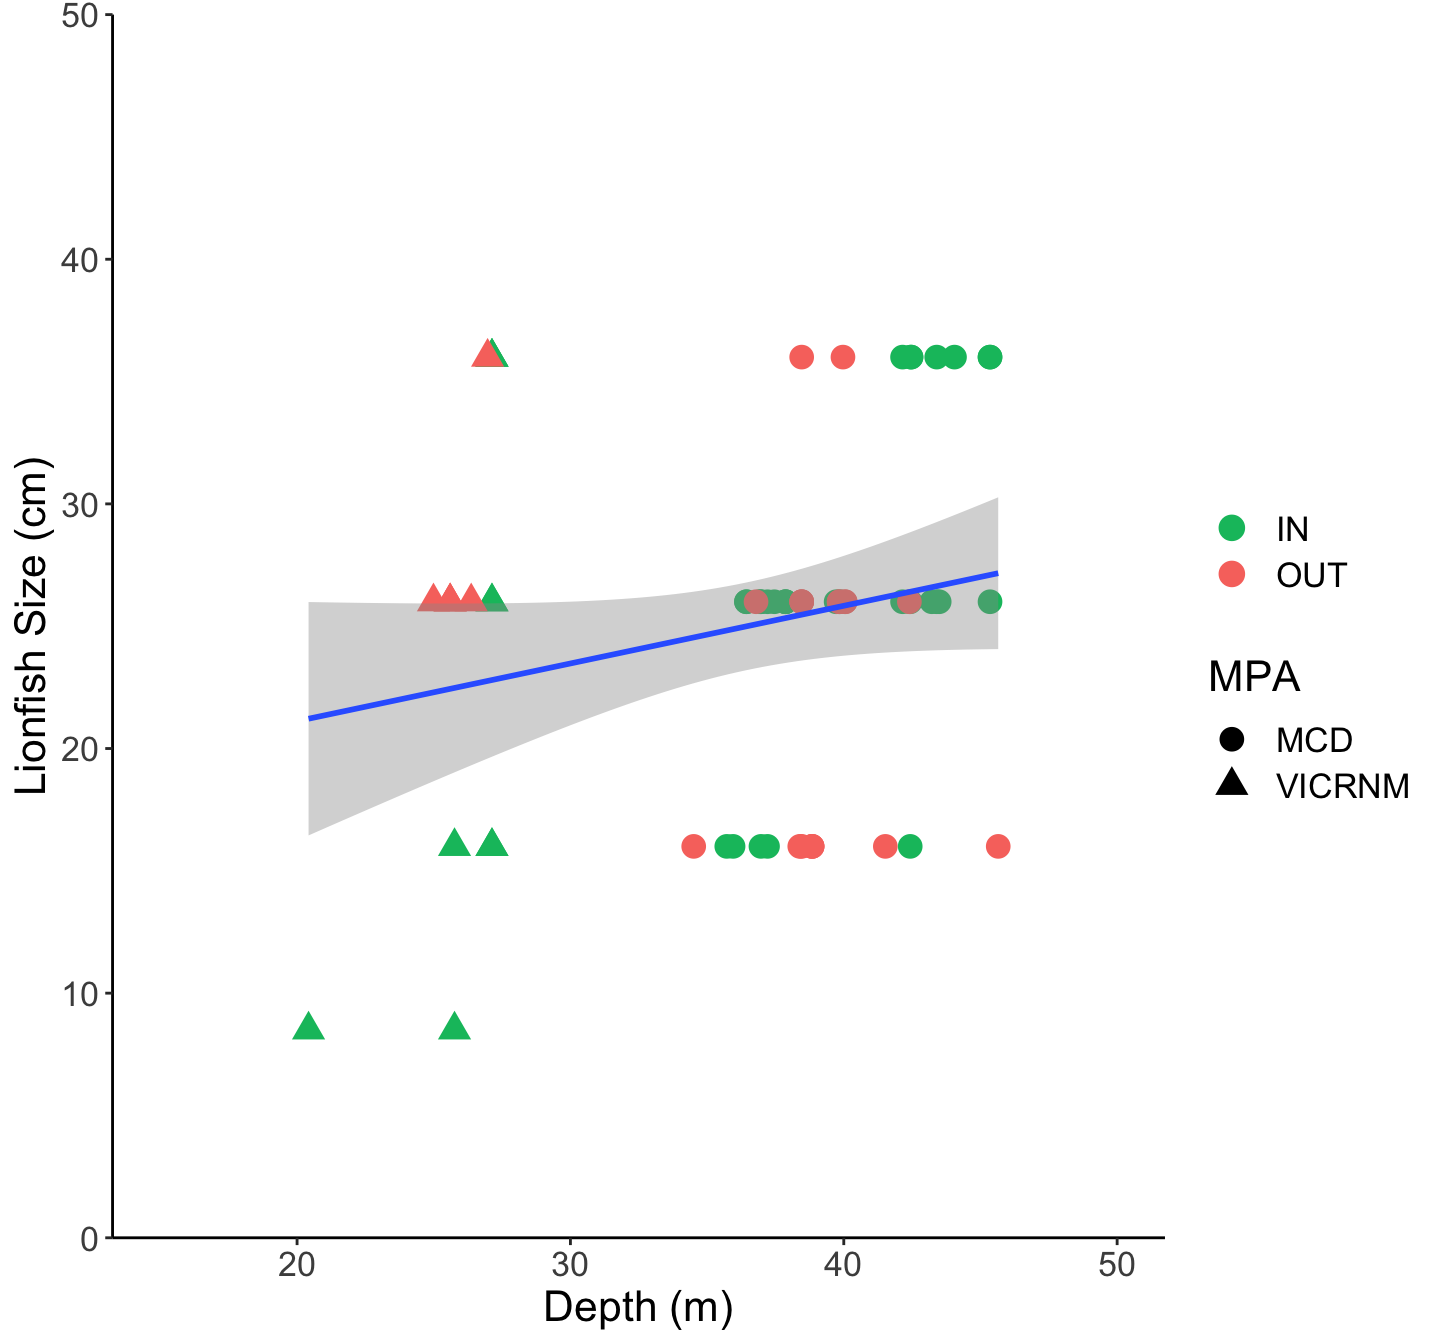
Total length of all observed lionfish by depth at which each was observed, separated by MPA and inside/outside MPA boundaries.
##
## Call:
## lm(formula = size ~ Zm_pos, data = lionsize)
##
## Residuals:
##      Min       1Q   Median       3Q      Max
## -13.9771  -6.8001   0.5285   3.5606  13.2376
##
## Coefficients:
##             Estimate Std. Error t value Pr(>|t|)
## (Intercept)  16.4034     5.1074   3.212  0.00208 **
## Zm_pos        0.2358     0.1379   1.710  0.09223 .
## ---
## Signif. codes:  0 '***' 0.001 '**' 0.01 '*' 0.05 '.' 0.1 ' ' 1
##
## Residual standard error: 7.232 on 63 degrees of freedom
## Multiple R-squared:  0.04434,    Adjusted R-squared:  0.02917
## F-statistic: 2.923 on 1 and 63 DF,  p-value: 0.09223
There was a suggestive relationship between depth and lionfish size (p=0.09), with larger lionfish tending to occur deeper. A more accurate relationship may be able to be determined with a higher-resolution size classification of lionfish.
Density with Depth

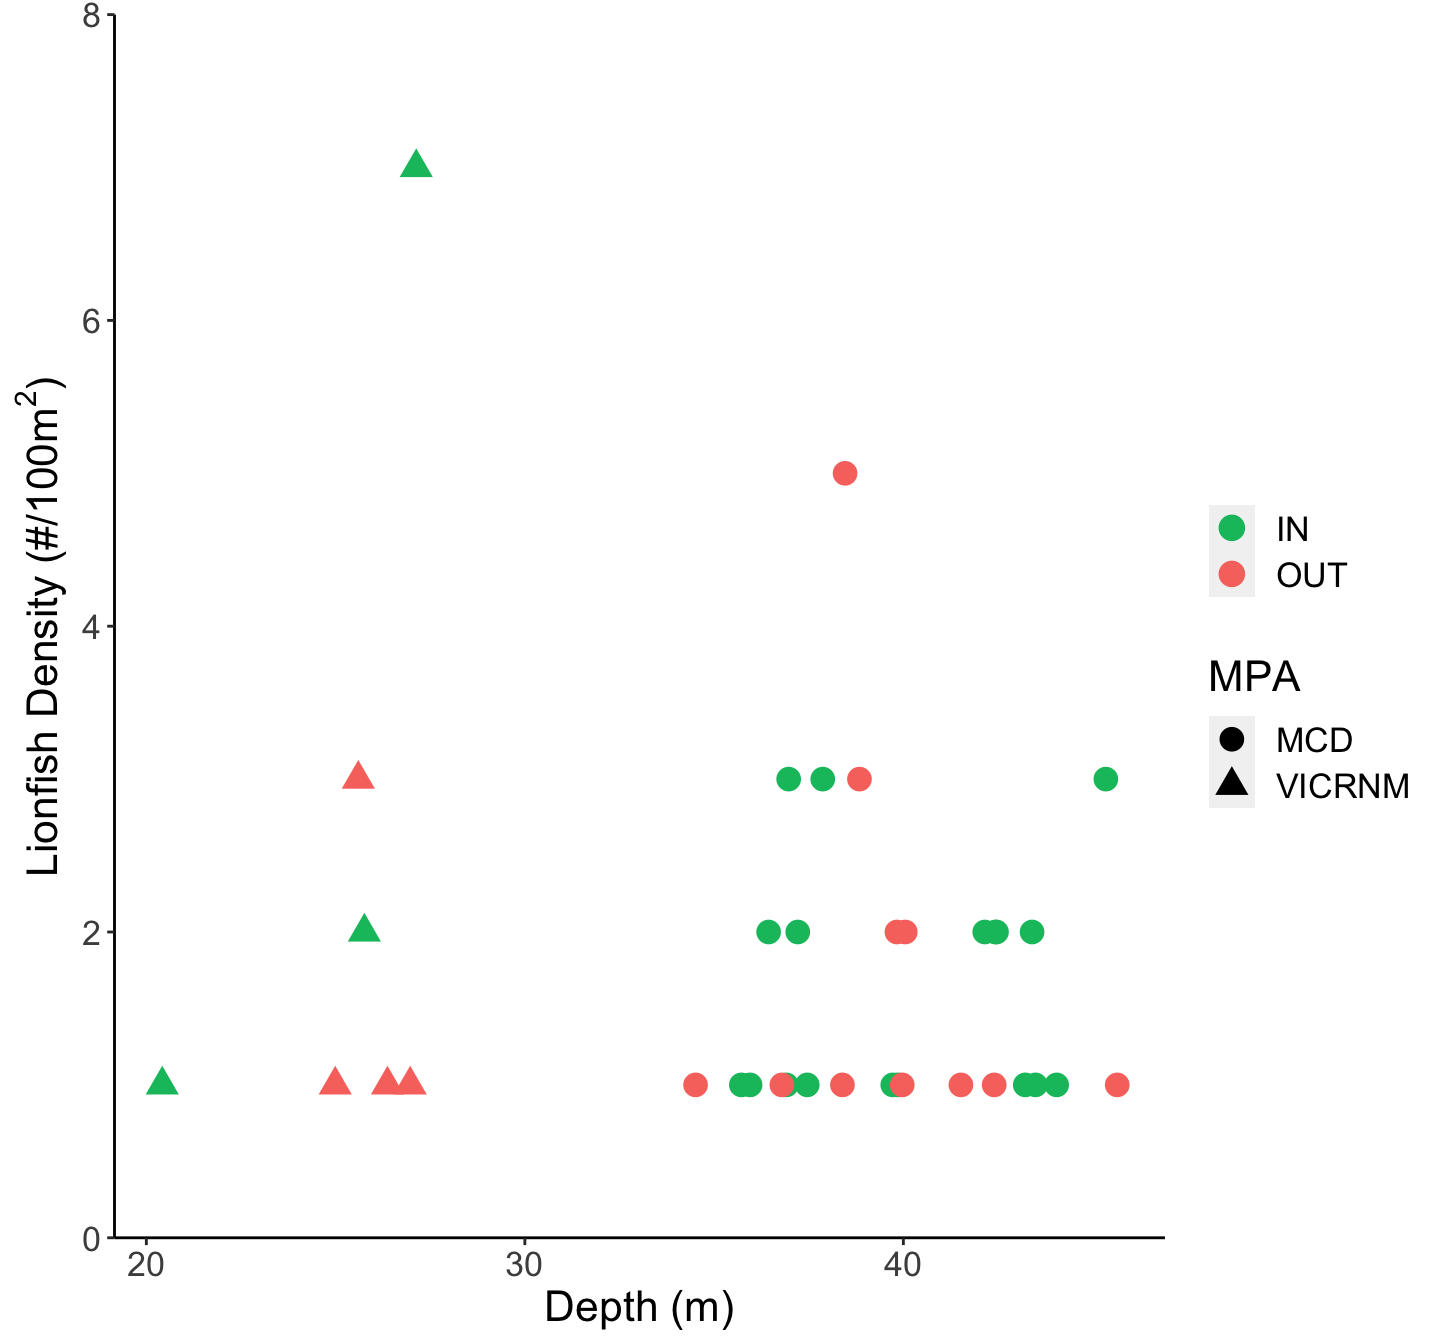
Number of lionfish seen at each site by depth of the site, separated by MPA and inside/outside MPA boundaries.
There was no apparent relationship between lionfish density and depth.
Biomass with Depth
## Warning: Removed 10 rows containing missing values (geom_smooth).
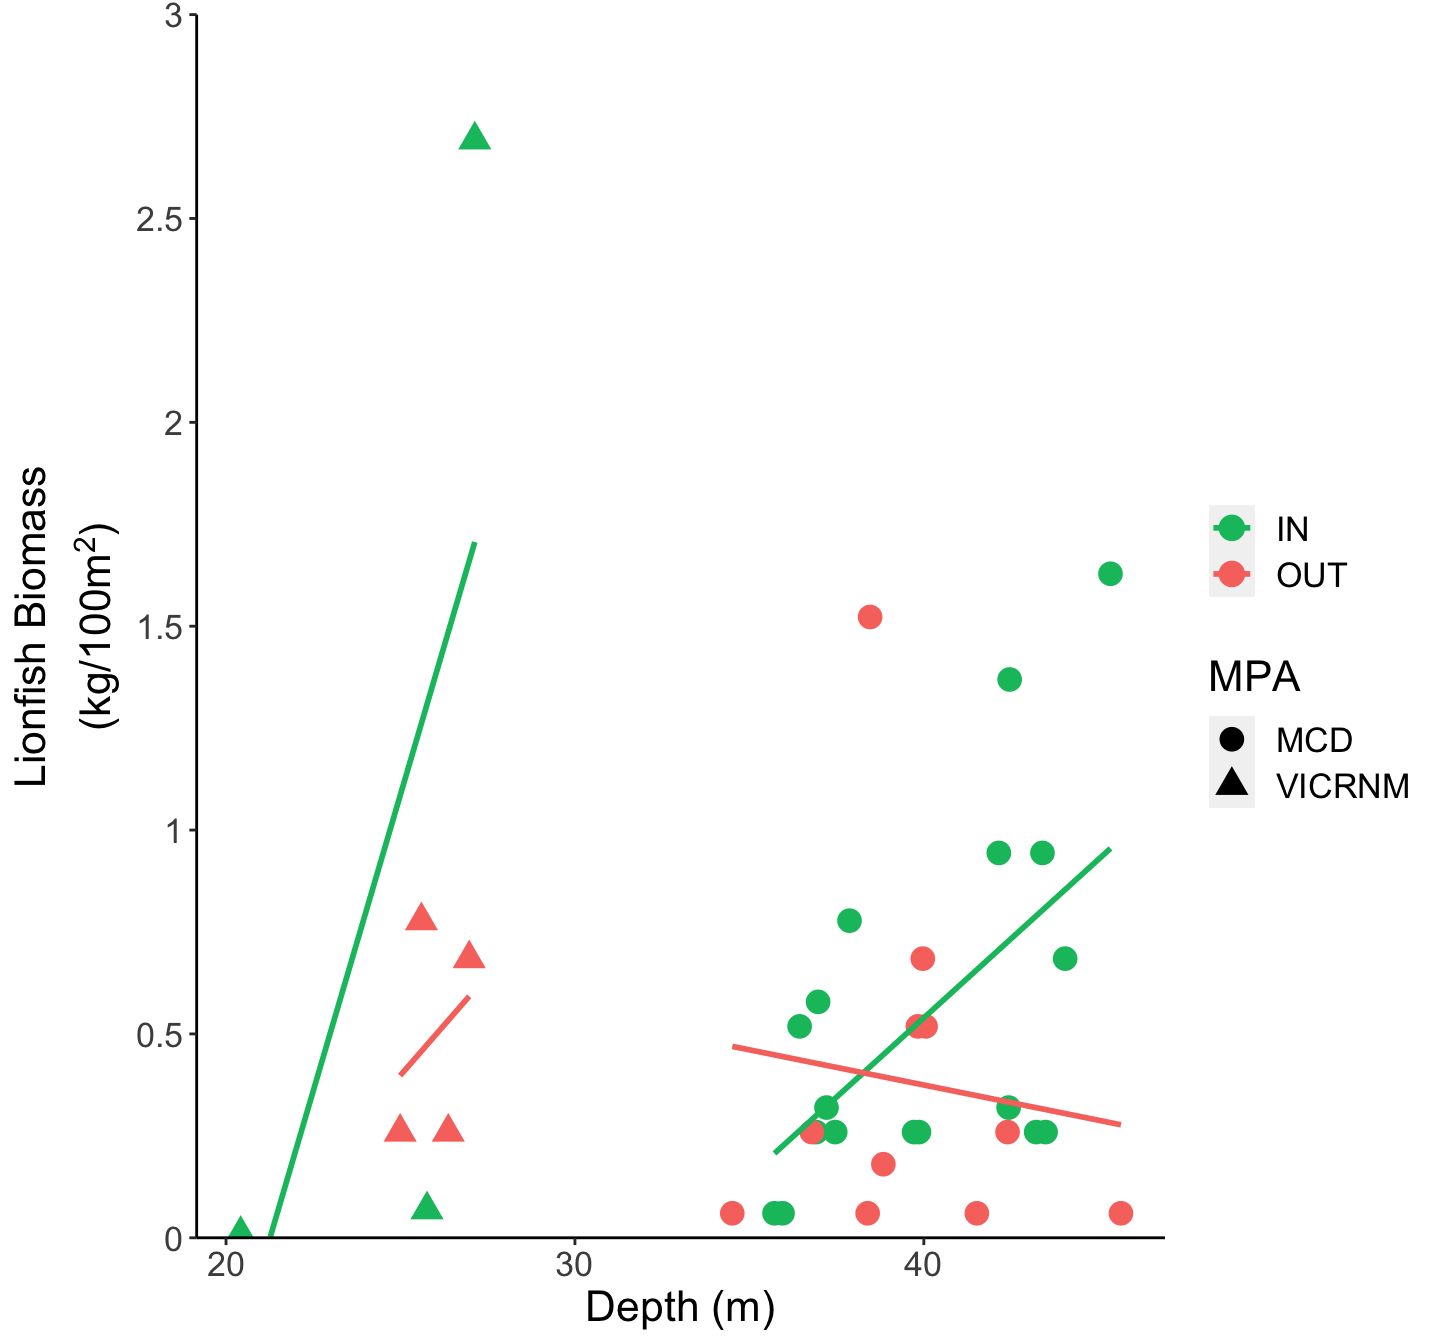
Biomass of lionfish seen at each site by depth of the site, separated by MPA and inside/outside MPA boundaries.
summary(lm(biokg ~ Zm_pos,
           filter(biodepthsum, MPA=="MCD" & InOut=="IN")))
##
## Call:
## lm(formula = biokg ~ Zm_pos, data = filter(biodepthsum, MPA ==
## "MCD" & InOut == "IN"))
##
## Residuals:
## Min 1Q Median 3Q Max
## -0.55120 -0.23610 -0.06146 0.25114 0.67365
##
## Coefficients:
## Estimate Std. Error t value Pr(>|t|)
## (Intercept) -2.56759 1.11271 -2.308 0.0347 *
## Zm_pos 0.07767 0.02771 2.804 0.0127 *
## ---
## Signif. codes: 0 '***' 0.001 '**' 0.01 '*' 0.05 '.' 0.1 ' ' 1
##
## Residual standard error: 0.3724 on 16 degrees of freedom
## Multiple R-squared: 0.3294, Adjusted R-squared: 0.2875
## F-statistic: 7.86 on 1 and 16 DF, p-value: 0.01275There is a significant positive relationship between depth and lionfish biomass within the MCD (p=0.03), which is where many of the lionfish were found (46%). There was no relationship, however, between depth and lionfish density, suggesting that larger lionfish tend to exist on deeper reefs.