Density and biomass of fish across MPA boundaries in the US Virgin Islands
Sarah Heidmann
8/31/2020
Summary
This document examines density and biomass of fish communities inside and outside the boundaries of the Hind Bank Marine Conservation District (MCD) and Virgin Islands Coral Reef National Monument (VICRNM).
Trophic groups
Density
| Trophic Group | MPA | Location | Mean Density | SD | n | SEM |
|---|---|---|---|---|---|---|
| all fish | MCD | IN | 154.84 | 110.37 | 31 | 19.82 |
| all fish | MCD | OUT | 129.27 | 100.39 | 30 | 18.33 |
| all fish | VICRNM | IN | 239.19 | 165.22 | 31 | 29.67 |
| all fish | VICRNM | OUT | 175.47 | 130.15 | 30 | 23.76 |
| herbivores | MCD | IN | 40.39 | 19.00 | 31 | 3.41 |
| herbivores | MCD | OUT | 36.50 | 19.01 | 30 | 3.47 |
| herbivores | VICRNM | IN | 65.10 | 35.74 | 31 | 6.42 |
| herbivores | VICRNM | OUT | 74.80 | 42.56 | 30 | 7.77 |
| piscivores | MCD | IN | 3.68 | 2.21 | 31 | 0.40 |
| piscivores | MCD | OUT | 4.63 | 3.84 | 30 | 0.70 |
| piscivores | VICRNM | IN | 6.45 | 7.40 | 31 | 1.33 |
| piscivores | VICRNM | OUT | 10.00 | 24.33 | 30 | 4.44 |
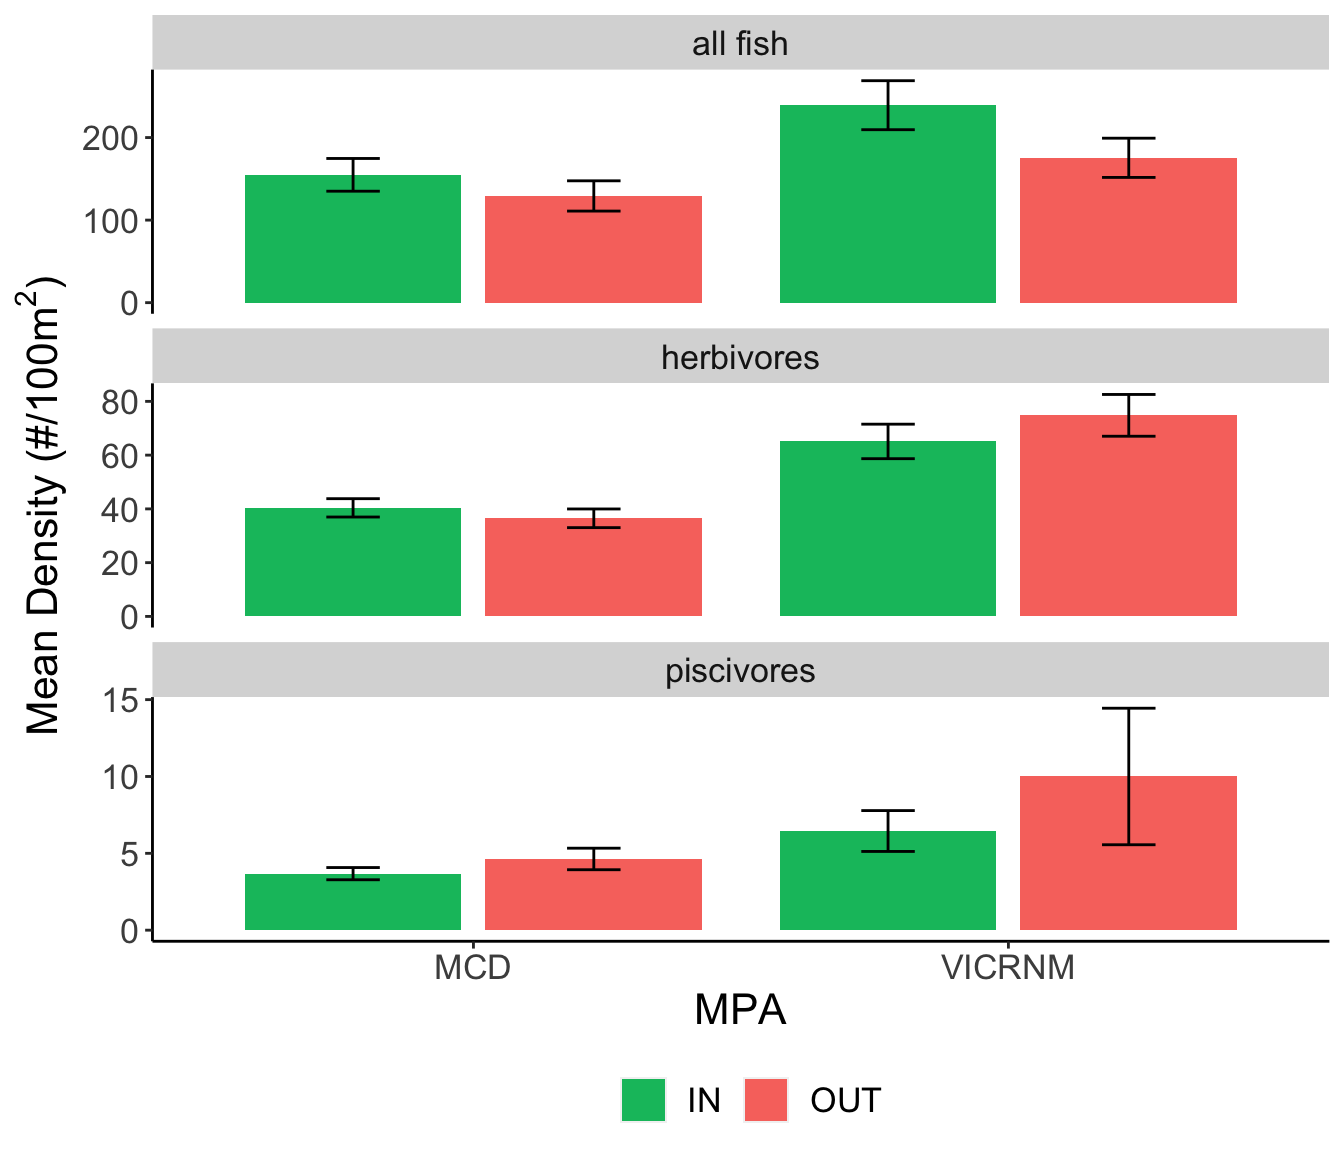
Mean fish density (#/100m2) for trophic groups of interest across sites. Error bars represent mean ± SE.
Herbivores, while present at all sites, were found at higher densities around the VICRNM than the MCD. Piscivores were present at most sites in low densities.
Biomass
| Trophic Group | MPA | Location | Mean Biomass (kg) | SD | n | SEM |
|---|---|---|---|---|---|---|
| all fish | MCD | IN | 6.57 | 4.69 | 31 | 0.84 |
| all fish | MCD | OUT | 10.19 | 8.83 | 30 | 1.61 |
| all fish | VICRNM | IN | 10.47 | 9.85 | 31 | 1.77 |
| all fish | VICRNM | OUT | 9.47 | 11.71 | 30 | 2.14 |
| herbivores | MCD | IN | 2.65 | 2.38 | 31 | 0.43 |
| herbivores | MCD | OUT | 2.74 | 2.42 | 30 | 0.44 |
| herbivores | VICRNM | IN | 2.44 | 2.99 | 31 | 0.54 |
| herbivores | VICRNM | OUT | 2.08 | 1.98 | 30 | 0.36 |
| piscivores | MCD | IN | 1.63 | 1.80 | 31 | 0.32 |
| piscivores | MCD | OUT | 3.82 | 5.94 | 30 | 1.08 |
| piscivores | VICRNM | IN | 2.33 | 3.39 | 31 | 0.61 |
| piscivores | VICRNM | OUT | 4.67 | 9.01 | 30 | 1.65 |
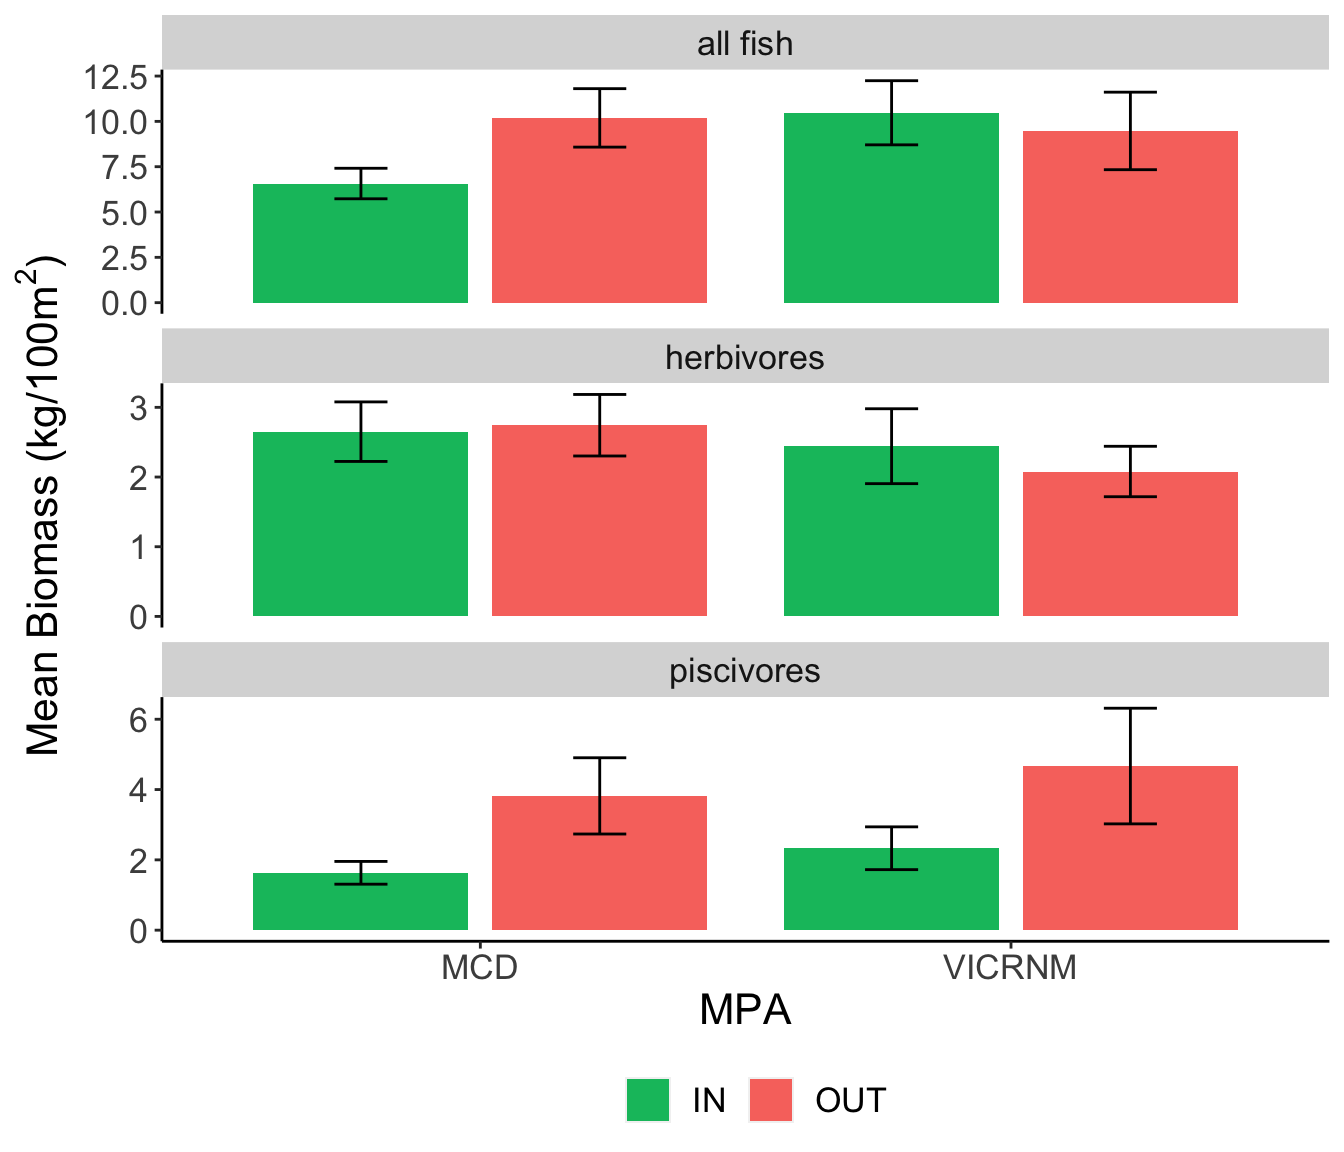
Mean fish biomass (kg/100m2) for trophic groups of interest across sites. Error bars represent mean ± SE.
Lionfish
Density
| MPA | Location | Mean Density | SD | n | SEM |
|---|---|---|---|---|---|
| MCD | IN | 0.97 | 1.02 | 31 | 0.18 |
| MCD | OUT | 0.63 | 1.00 | 30 | 0.18 |
| VICRNM | IN | 0.32 | 1.30 | 31 | 0.23 |
| VICRNM | OUT | 0.20 | 0.61 | 30 | 0.11 |
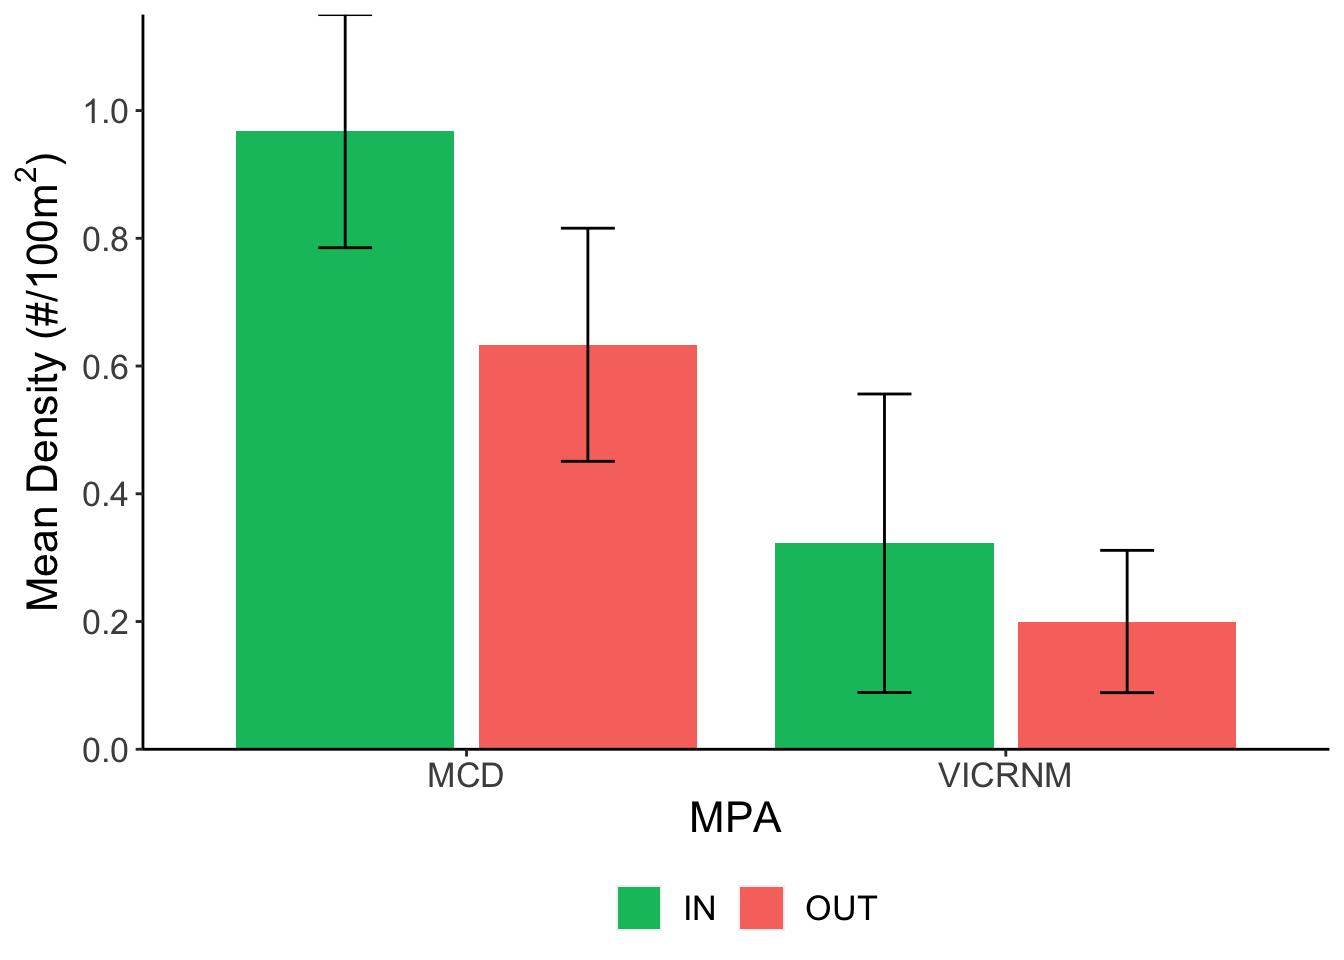
Mean lionfish density (#/100m2) across sites. Error bars represent mean ± SE.
lionDensAnova <- aov(TotalNumber ~ MPA * InOut,
                     data = filter(dl, ScientificName=="Pterois volitans"))
summary(lionDensAnova)
## Df Sum Sq Mean Sq F value Pr(>F)
## MPA 1 8.93 8.926 8.668 0.0039 **
## InOut 1 1.59 1.592 1.546 0.2162
## MPA:InOut 1 0.34 0.342 0.332 0.5655
## Residuals 118 121.51 1.030
## ---
## Signif. codes: 0 '***' 0.001 '**' 0.01 '*' 0.05 '.' 0.1 ' ' 1TukeyHSD(lionDensAnova, which ="MPA")## Tukey multiple comparisons of means
## 95% family-wise confidence level
##
## Fit: aov(formula = TotalNumber ~ MPA * InOut, data = filter(dl, ScientificName == "Pterois volitans"))
##
## $MPA
## diff lwr upr p adj
## VICRNM-MCD -0.5409836 -0.9048463 -0.1771209 0.0039002Lionfish densities were not significantly different inside and outside MPAs (p=0.2), but were significantly higher around the MCD (inside and outside) than around the VICRNM (p<0.01). This may be due to the fact that the MCD is deeper and has a higher rugosity than the VICRNM, which may be a more attractive habitat for lionfish.
Biomass
| MPA | Location | Mean Biomass (kg) | SD | n | SEM |
|---|---|---|---|---|---|
| MCD | IN | 0.31 | 0.43 | 31 | 0.08 |
| MCD | OUT | 0.14 | 0.31 | 30 | 0.06 |
| VICRNM | IN | 0.09 | 0.48 | 31 | 0.09 |
| VICRNM | OUT | 0.07 | 0.19 | 30 | 0.04 |
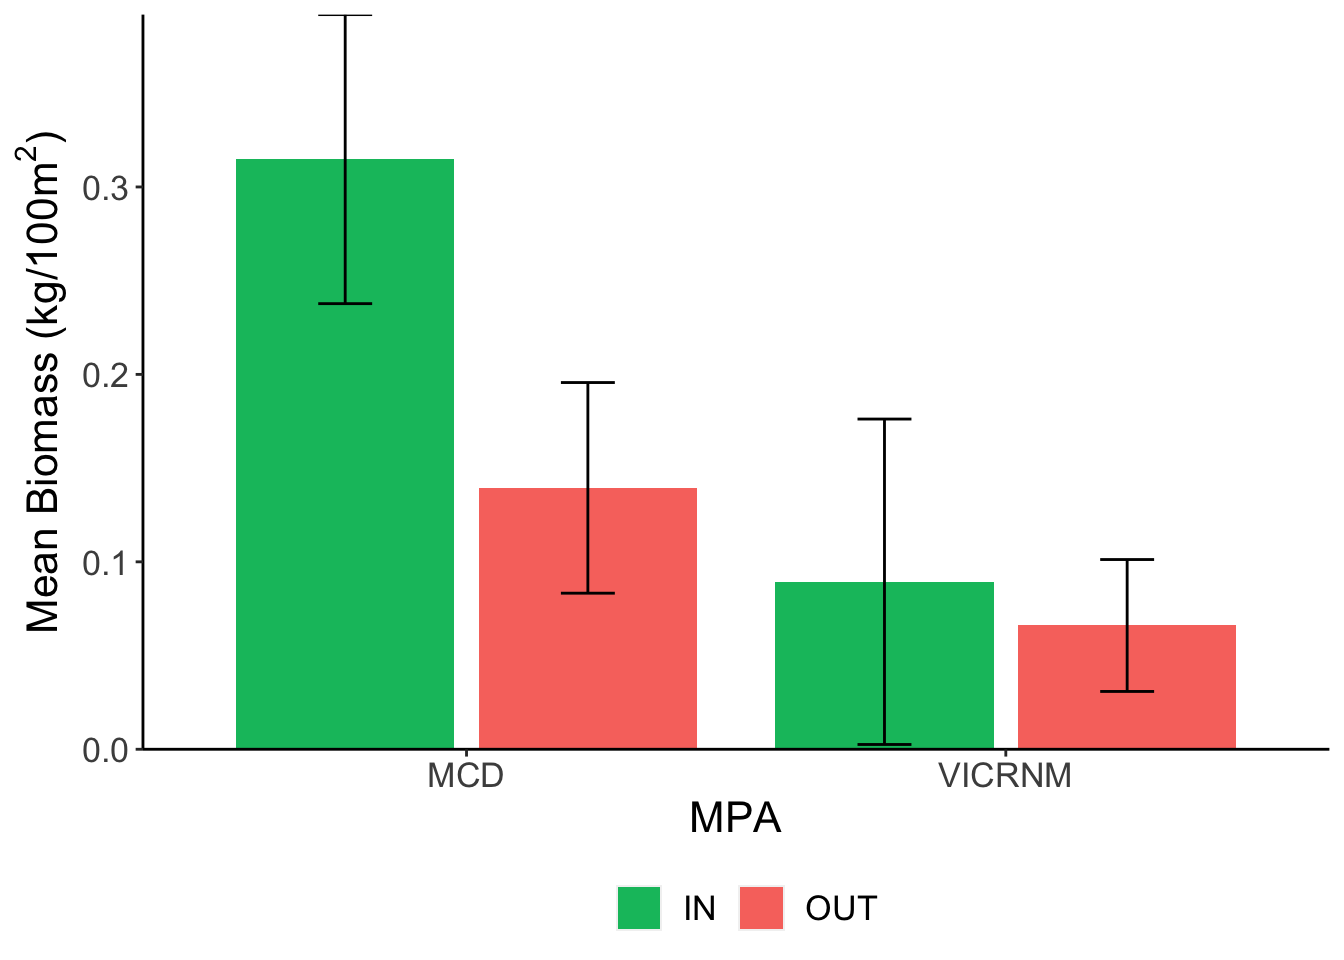
Mean lionfish biomass (kg/100m2) across sites. Error bars represent mean ± SE.
Lionfish biomass showed a similar pattern to density across locations.
Groups of interest
Density
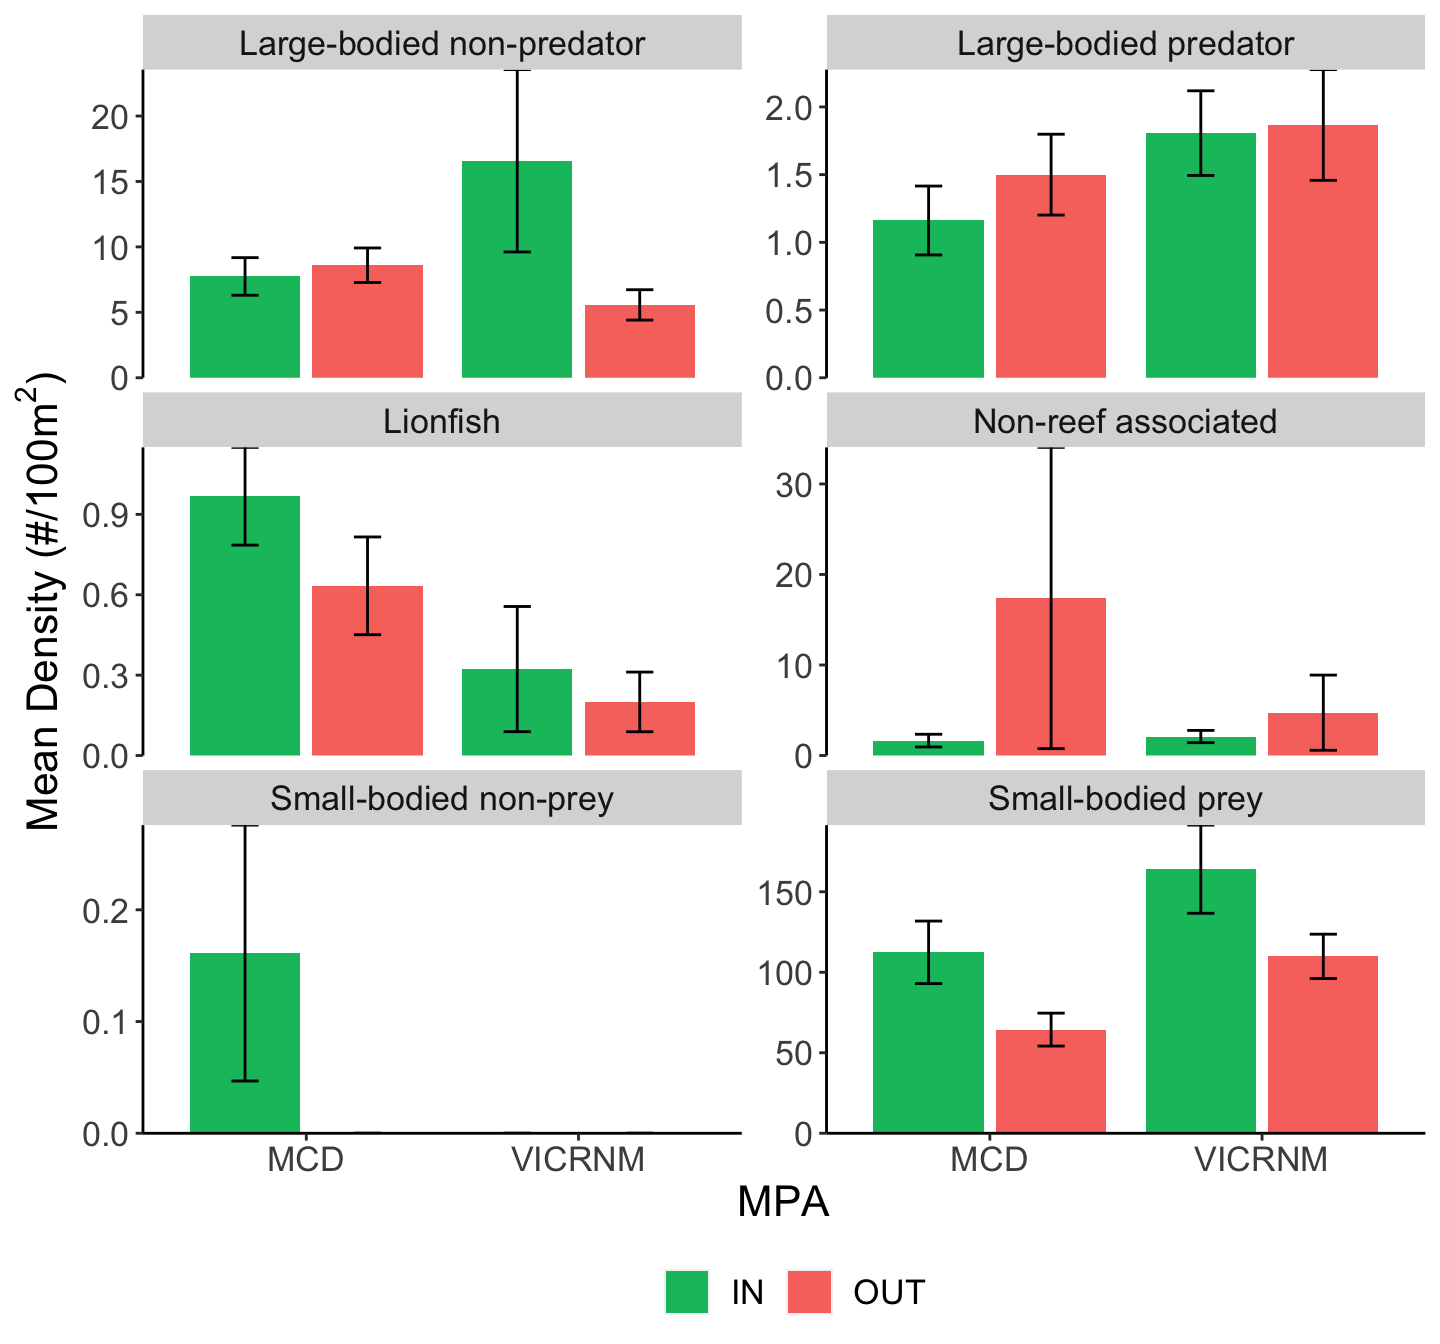
Mean fish density (#/100m2 ± SE) across sites for all lionfish and other groups of interest, separated by MPA and inside/outside MPA boundaries. Groups were adapted from Green et al (2012).
While it appears there might be a difference in large-bodied predator density between MPAs, the difference was not significant (see ANOVA table below).
##                Df Sum Sq Mean Sq F value Pr(>F)
## MPA             1    0.1 0.06675   2.526  0.112
## InOut           1    0.0 0.01028   0.389  0.533
## MPA:InOut       1    0.0 0.00501   0.190  0.663
## Residuals   14392  380.3 0.02643
Biomass
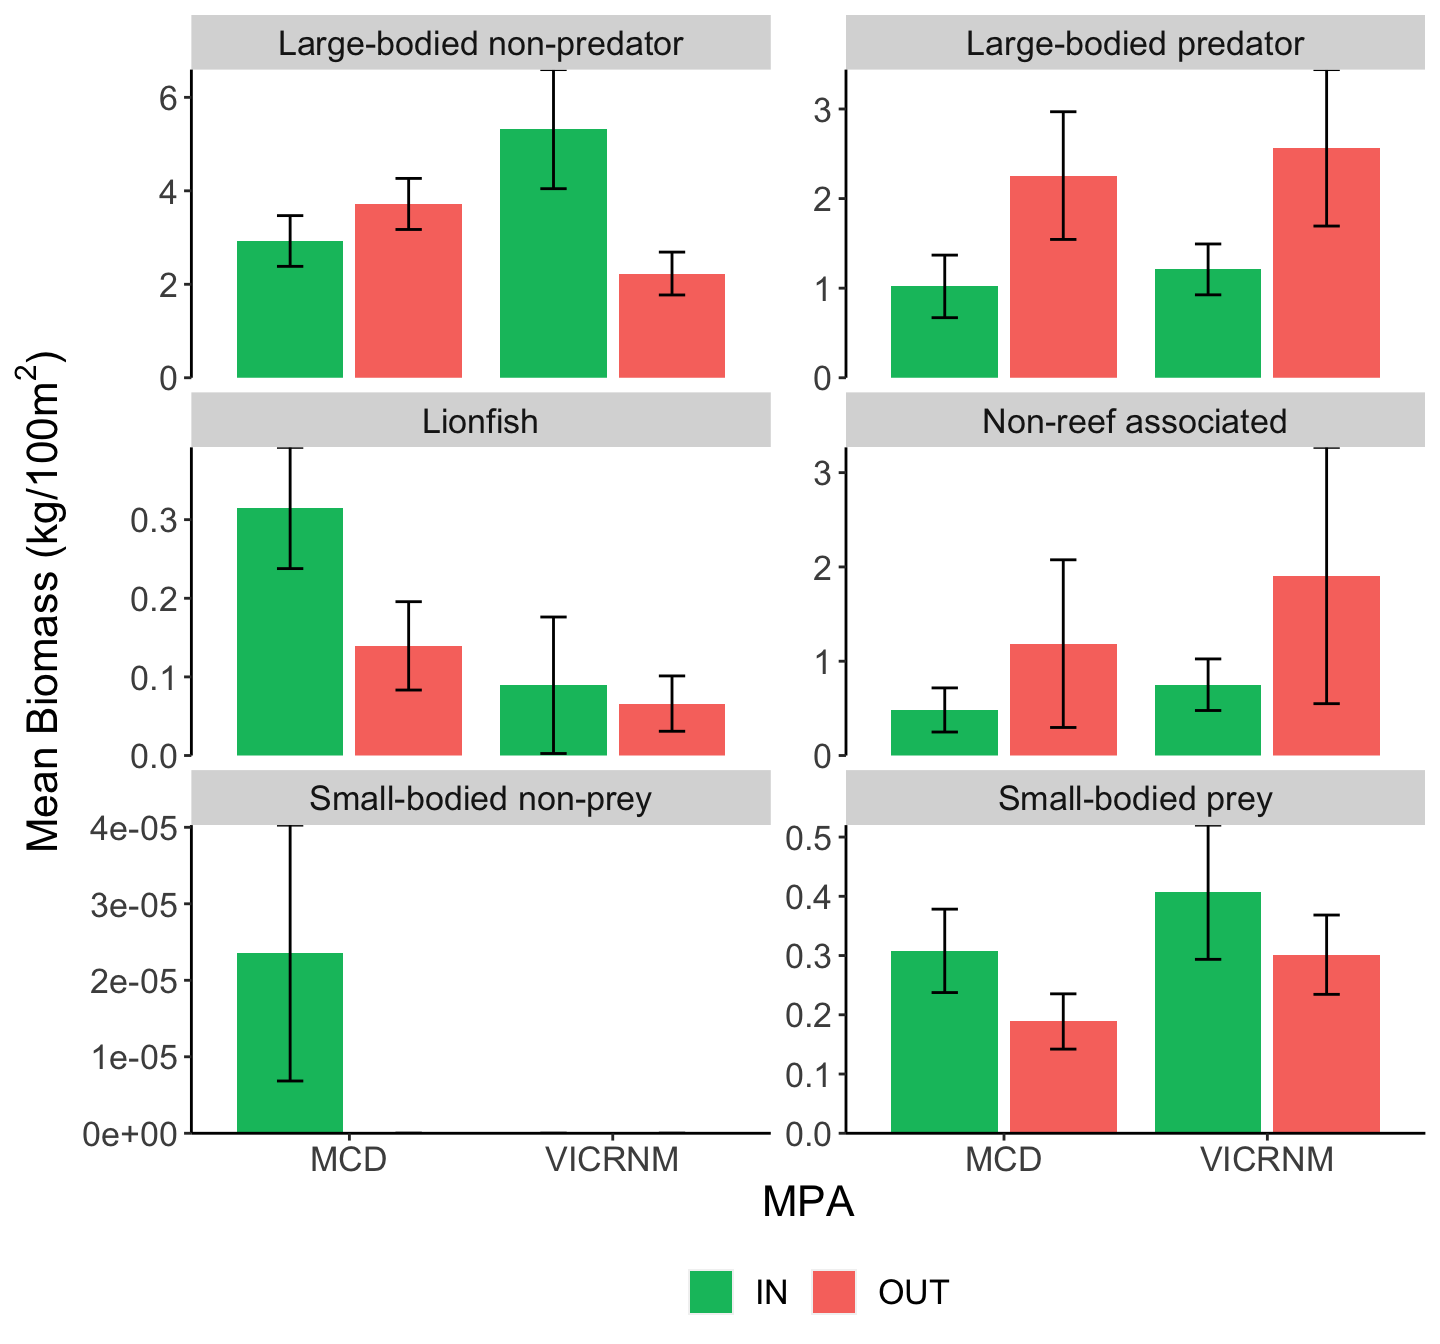
Mean fish biomass (kg/100m2 ± SE) across sites for all lionfish and other groups of interest, separated by MPA and inside/outside MPA boundaries. Groups were adapted from Green et al (2012).
There seems to be no relationship between density or biomass of lionfish and small-bodied prey fish, potential lionfish predators, or other functional groups. At the time of these recent surveys, lionfish density has had no clear direct or indirect impacts on native fish populations, although here was large variation in the density and biomass of each of these groups across sites.
While there was no significant difference in large-bodied predator density between MPAs, there was a significantly higher biomass of large-bodied predators outside MPAs than inside (see ANOVA table below).
##                Df    Sum Sq Mean Sq F value Pr(>F)
## MPA             1 1.600e+04   15999   0.173 0.6774
## InOut           1 4.346e+05  434620   4.702 0.0301 *
## MPA:InOut       1 9.330e+02     933   0.010 0.9200
## Residuals   14392 1.330e+09   92439
## ---
## Signif. codes:  0 '***' 0.001 '**' 0.01 '*' 0.05 '.' 0.1 ' ' 1
Families
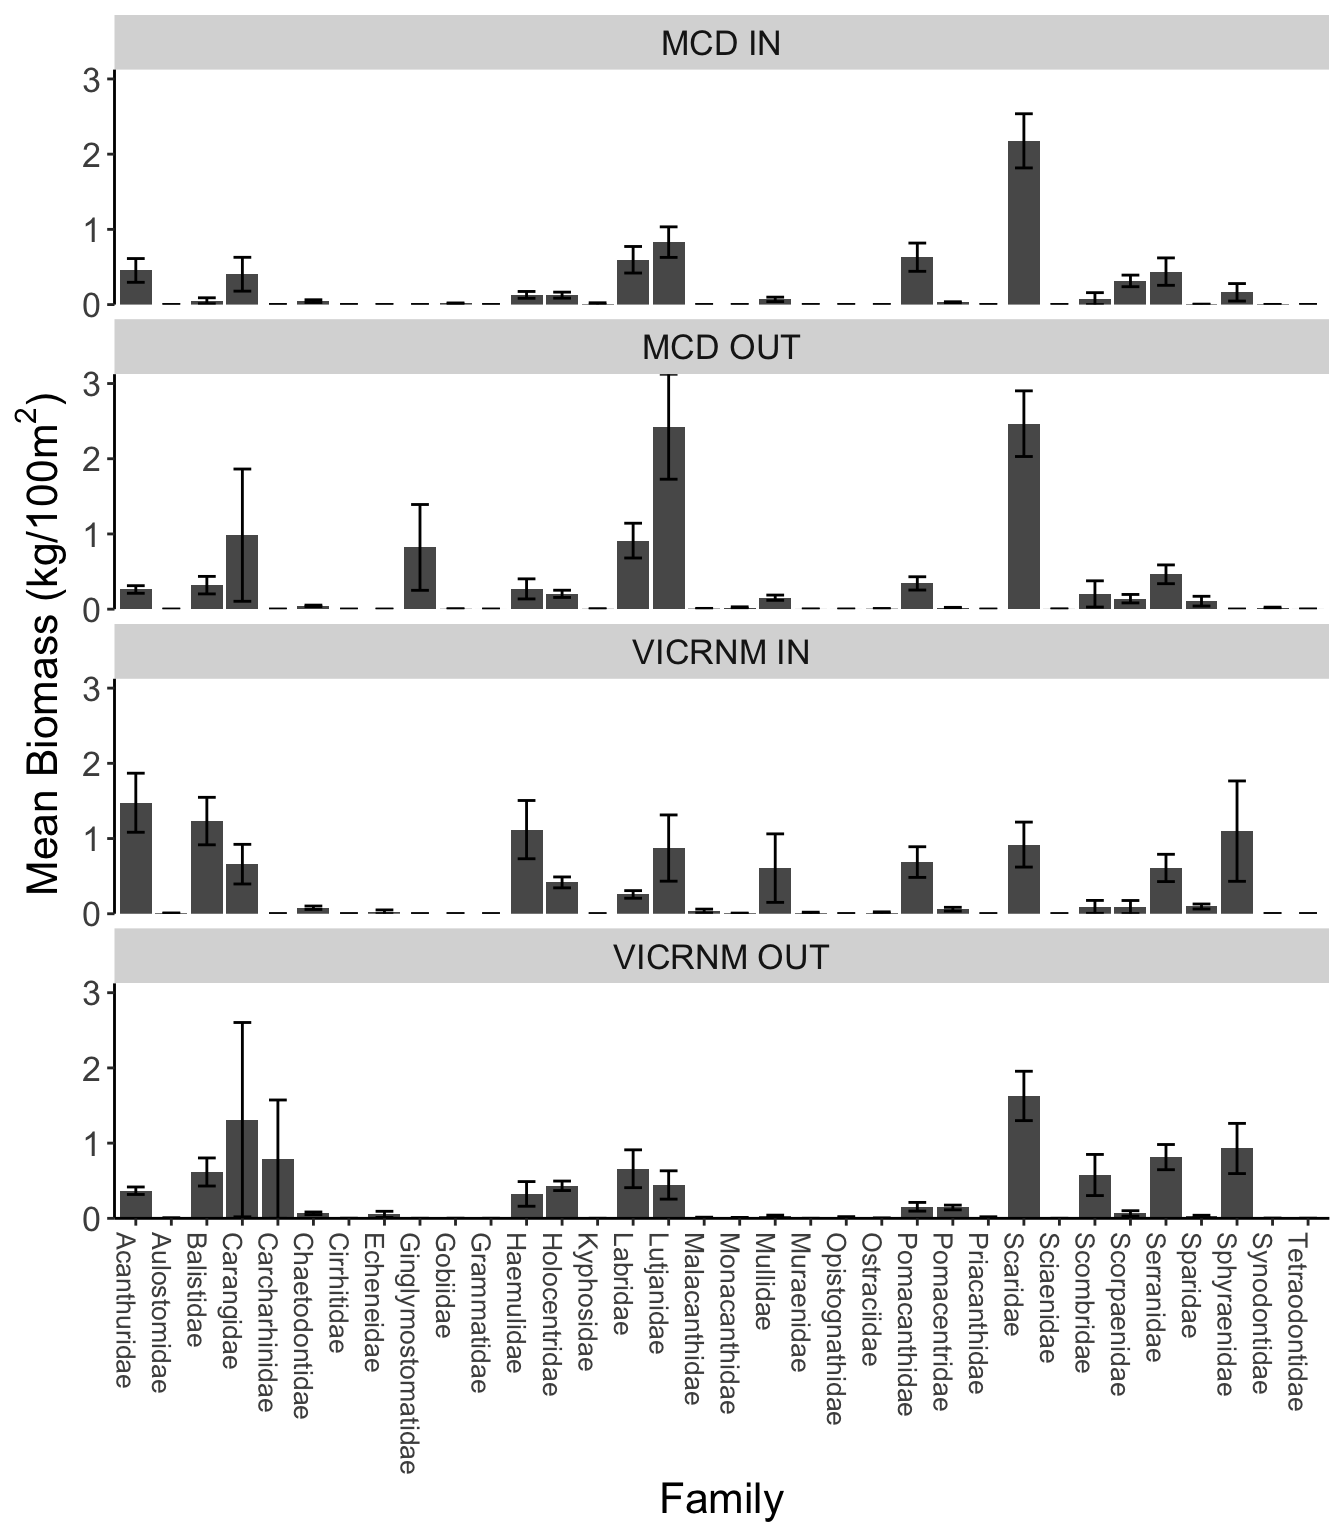
Mean fish family biomass (kg/100m2 ± SE) across sites, separated by MPA and inside/outside MPA boundaries.
There was higher biomass of several fish families inside VICRNM than other areas, including Acanthuridae (surgeonfishes), Balistidae (triggerfish), Haemulidae (grunts), Mullidae (goatfish), and Pomacanthidae (angelfish).
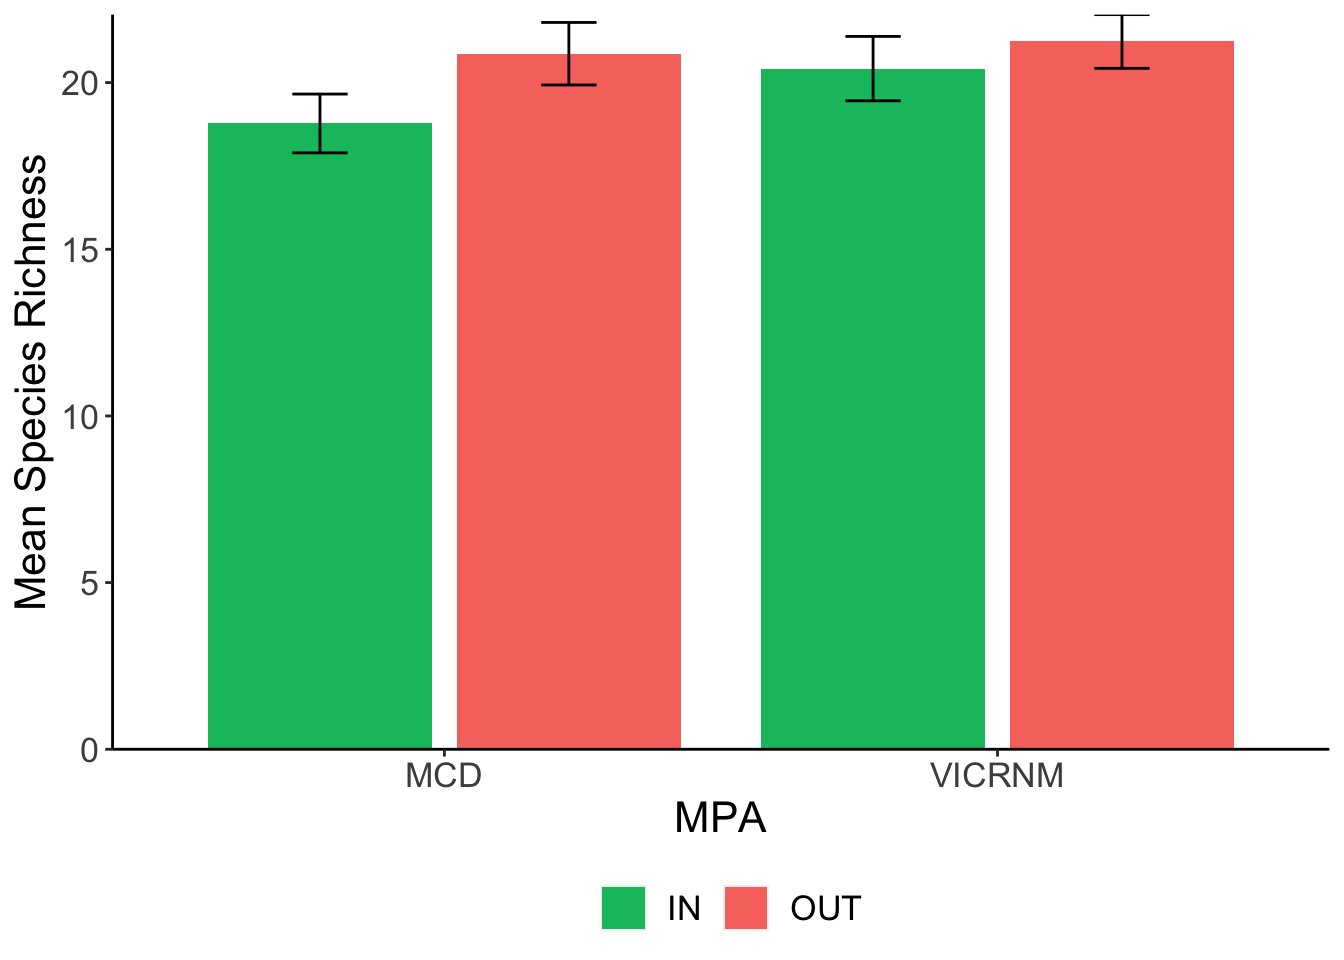
Species Richness
| MPA | Location | Mean Richness | SD | n | SEM |
|---|---|---|---|---|---|
| MCD | IN | 18.77 | 4.91 | 31 | 0.88 |
| MCD | OUT | 20.87 | 5.14 | 30 | 0.94 |
| VICRNM | IN | 20.42 | 5.38 | 31 | 0.97 |
| VICRNM | OUT | 21.23 | 4.42 | 30 | 0.81 |
##              Df Sum Sq Mean Sq F value Pr(>F)
## MPA           1   31.5   31.51   1.272  0.262
## InOut         1   64.4   64.39   2.601  0.109
## MPA:InOut     1   12.5   12.46   0.503  0.479
## Residuals   118 2921.8   24.76
Fish species richness was not significantly different across MPAs, nor across boundaries near an MPA.