Rugosity
Sarah Heidmann
9/10/2020
Summary
This document examines patterns in fish communities as they relate to rugosity inside and outside the boundaries of the Hind Bank Marine Conservation District (MCD) and Virgin Islands Coral Reef National Monument (VICRNM).
Rugosity by MPA
##               Df Sum Sq Mean Sq F value Pr(>F)
## MPA            1 117935  117935 159.794 <2e-16 ***
## `IN/OUT`       1   1480    1480   2.005  0.160
## MPA:`IN/OUT`   1   1274    1274   1.726  0.192
## Residuals    110  81185     738
## ---
## Signif. codes:  0 '***' 0.001 '**' 0.01 '*' 0.05 '.' 0.1 ' ' 1
## 6 observations deleted due to missingness
Mean rugosity was significantly higher around the MCD than the VICRNM (p<0.001), but there were no differences when comparing inside to outside for each MPA.
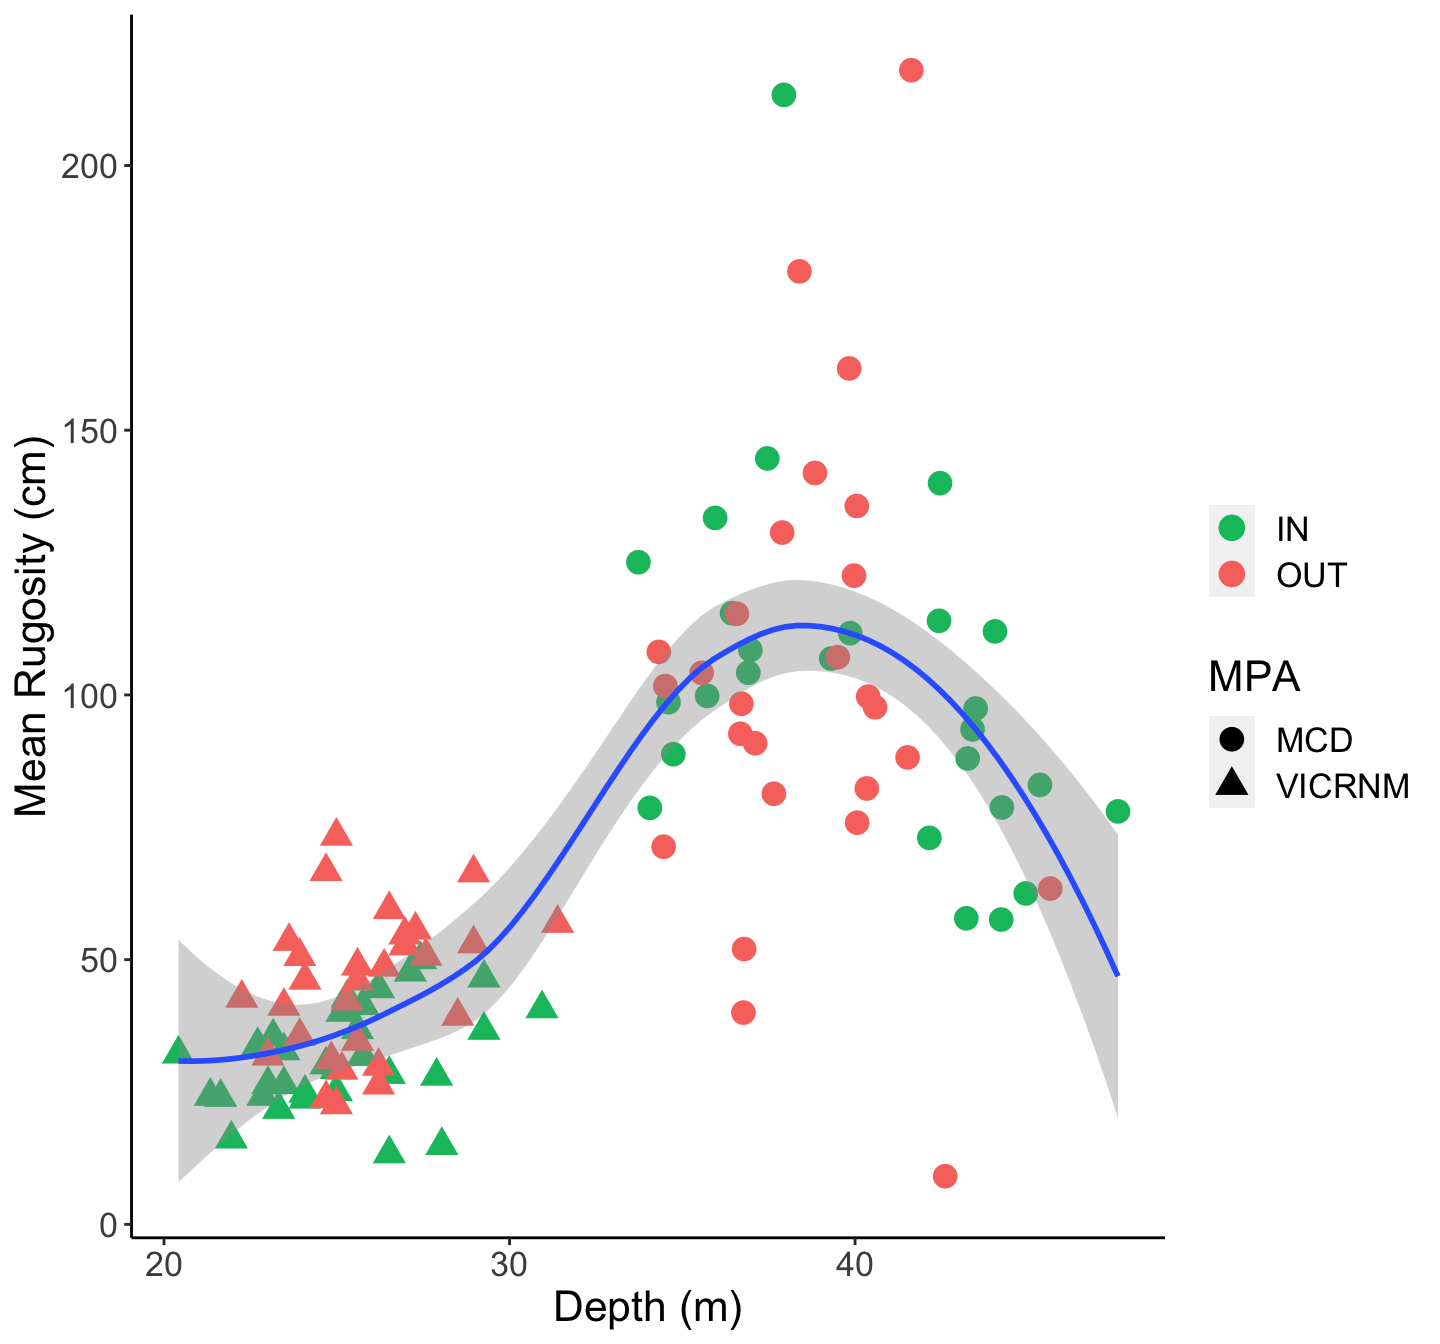
Mean rugosity (cm) of sites by depth of site (m). Shape indicates the MPA in which the site was located, and color indicates whether the site was inside or outside the MPA.
Lionfish
Density
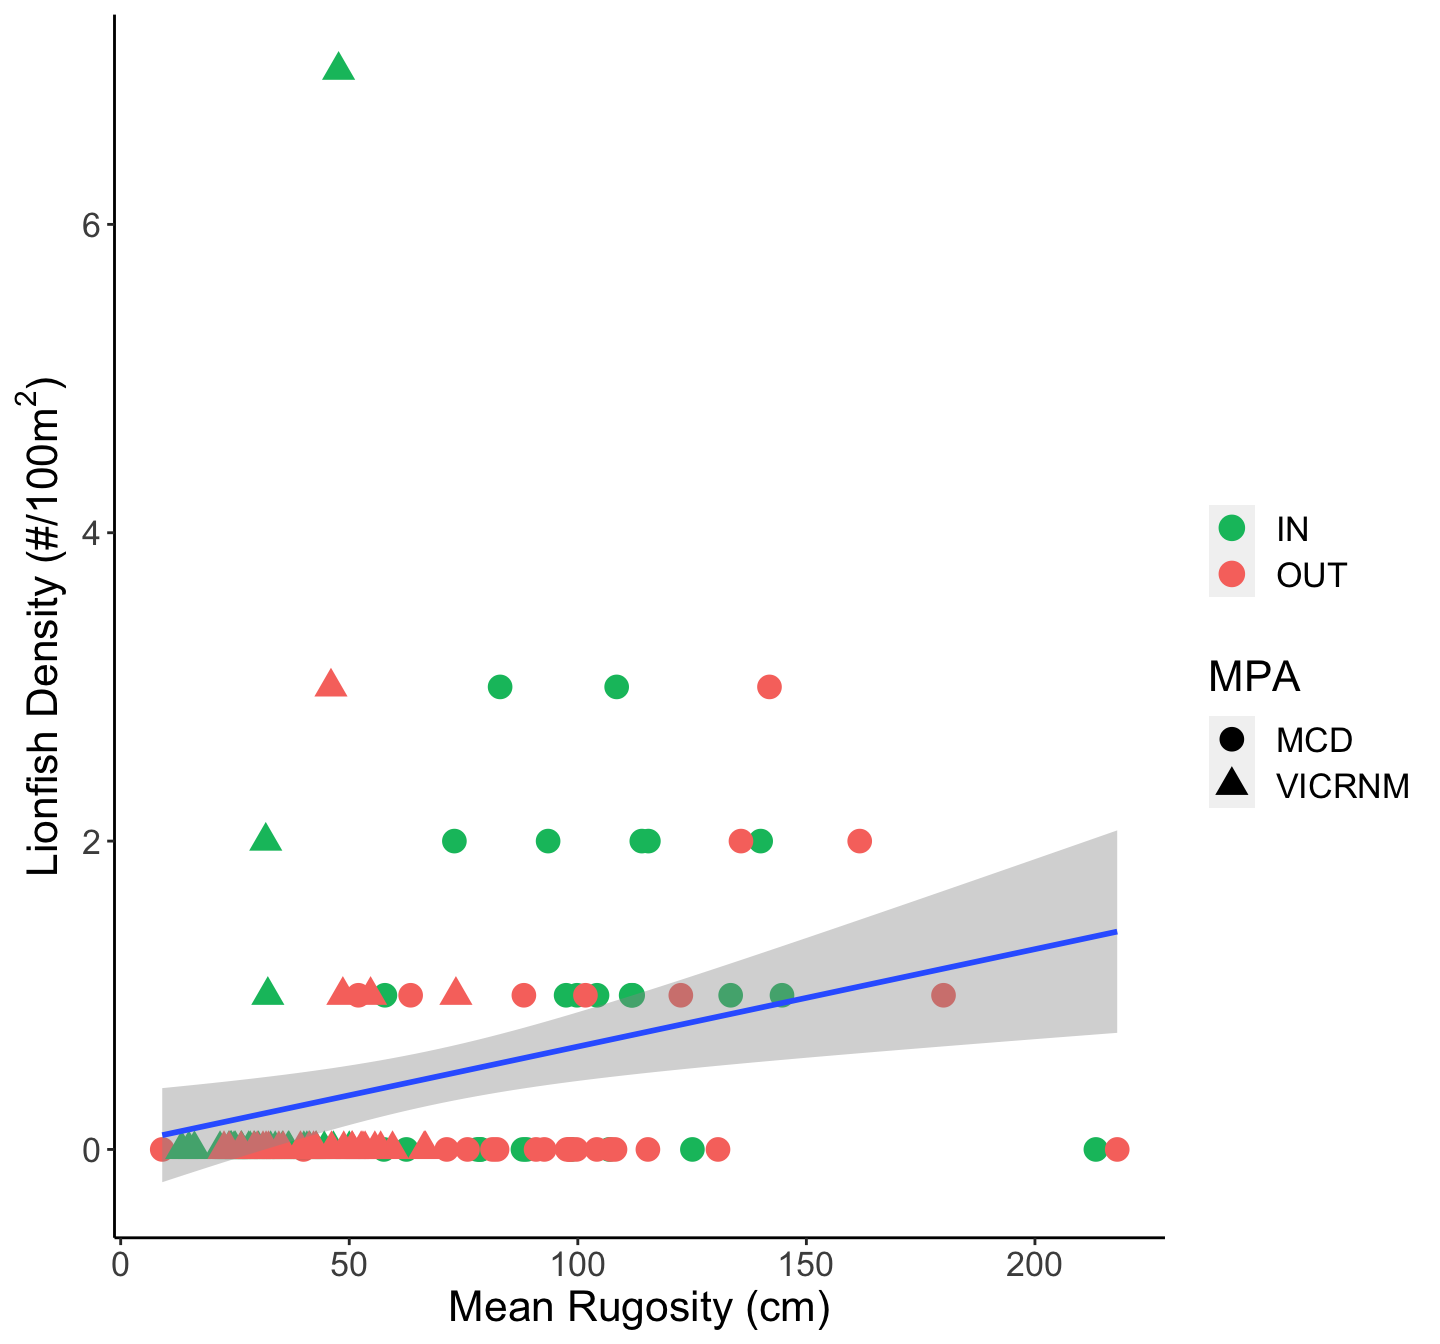
Lionfish density at sites by rugosity of site. Shape indicates the MPA in which the site was located, and color indicates whether the site was inside or outside the MPA.
Biomass
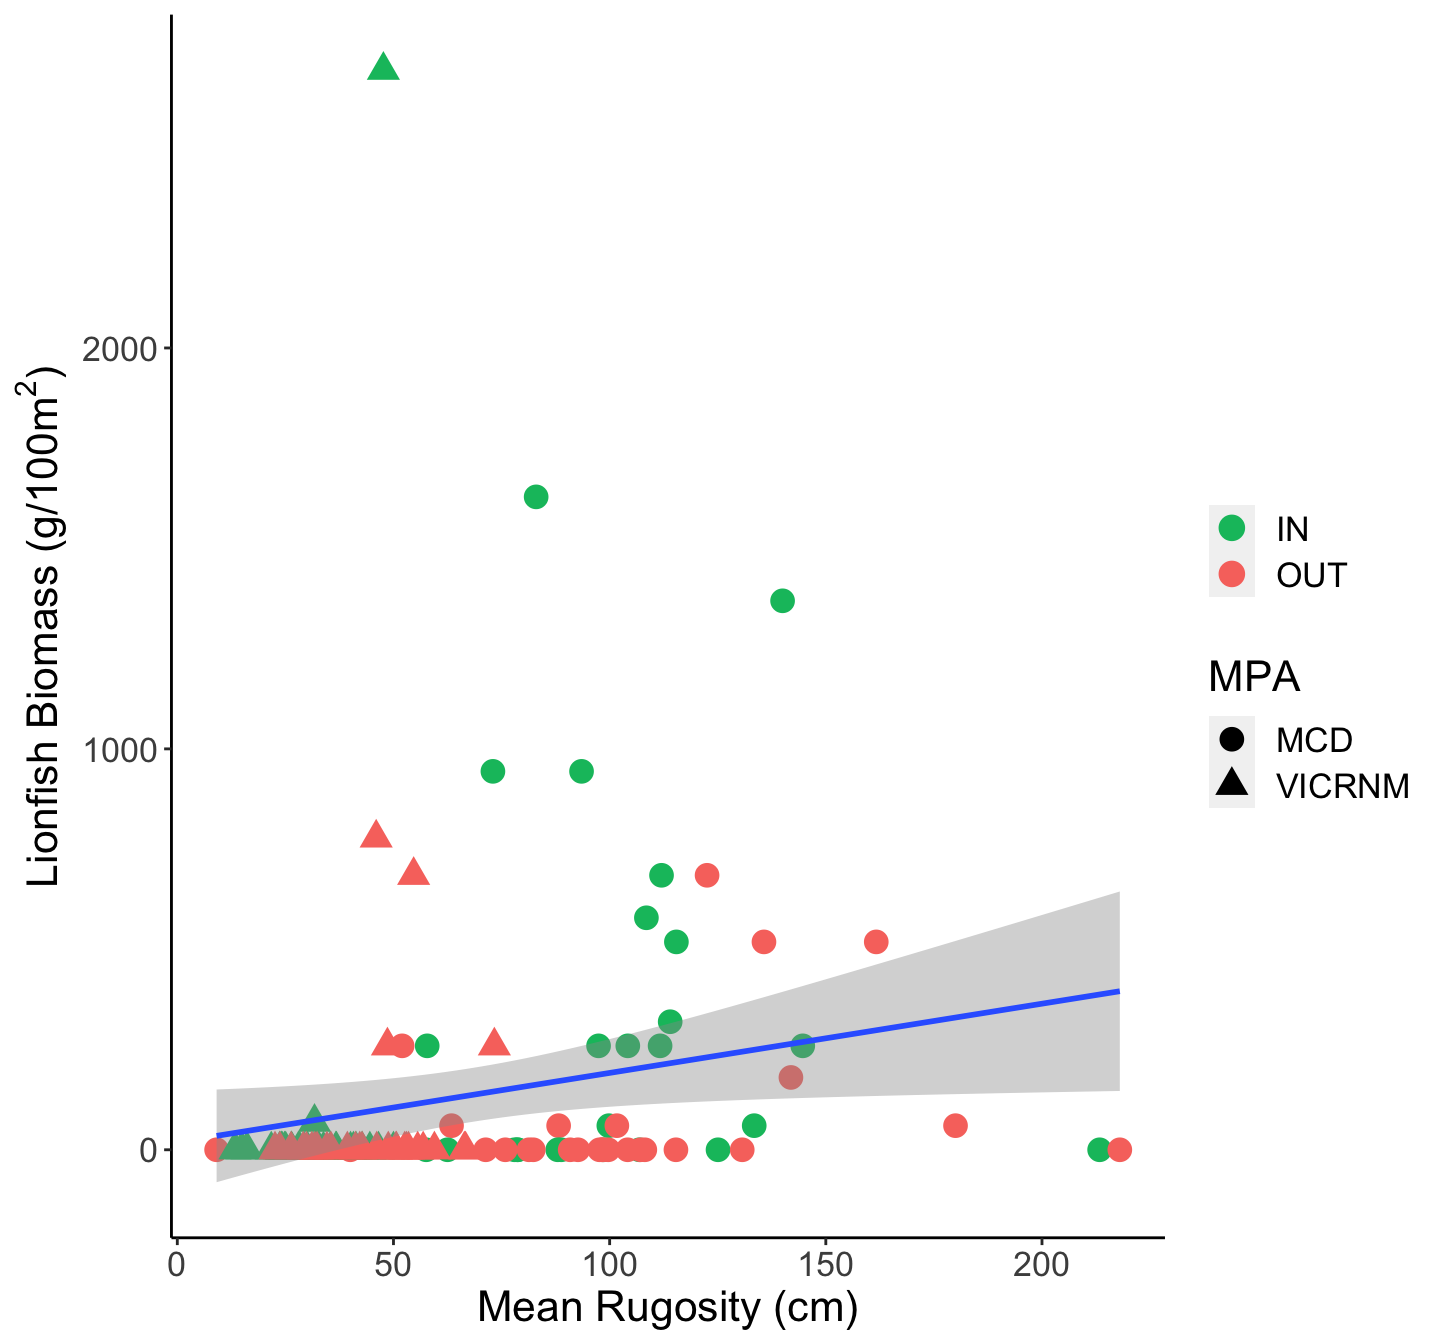
Lionfish biomass at sites by rugosity of site. Shape indicates the MPA in which the site was located, and color indicates whether the site was inside or outside the MPA.
All fish
Density
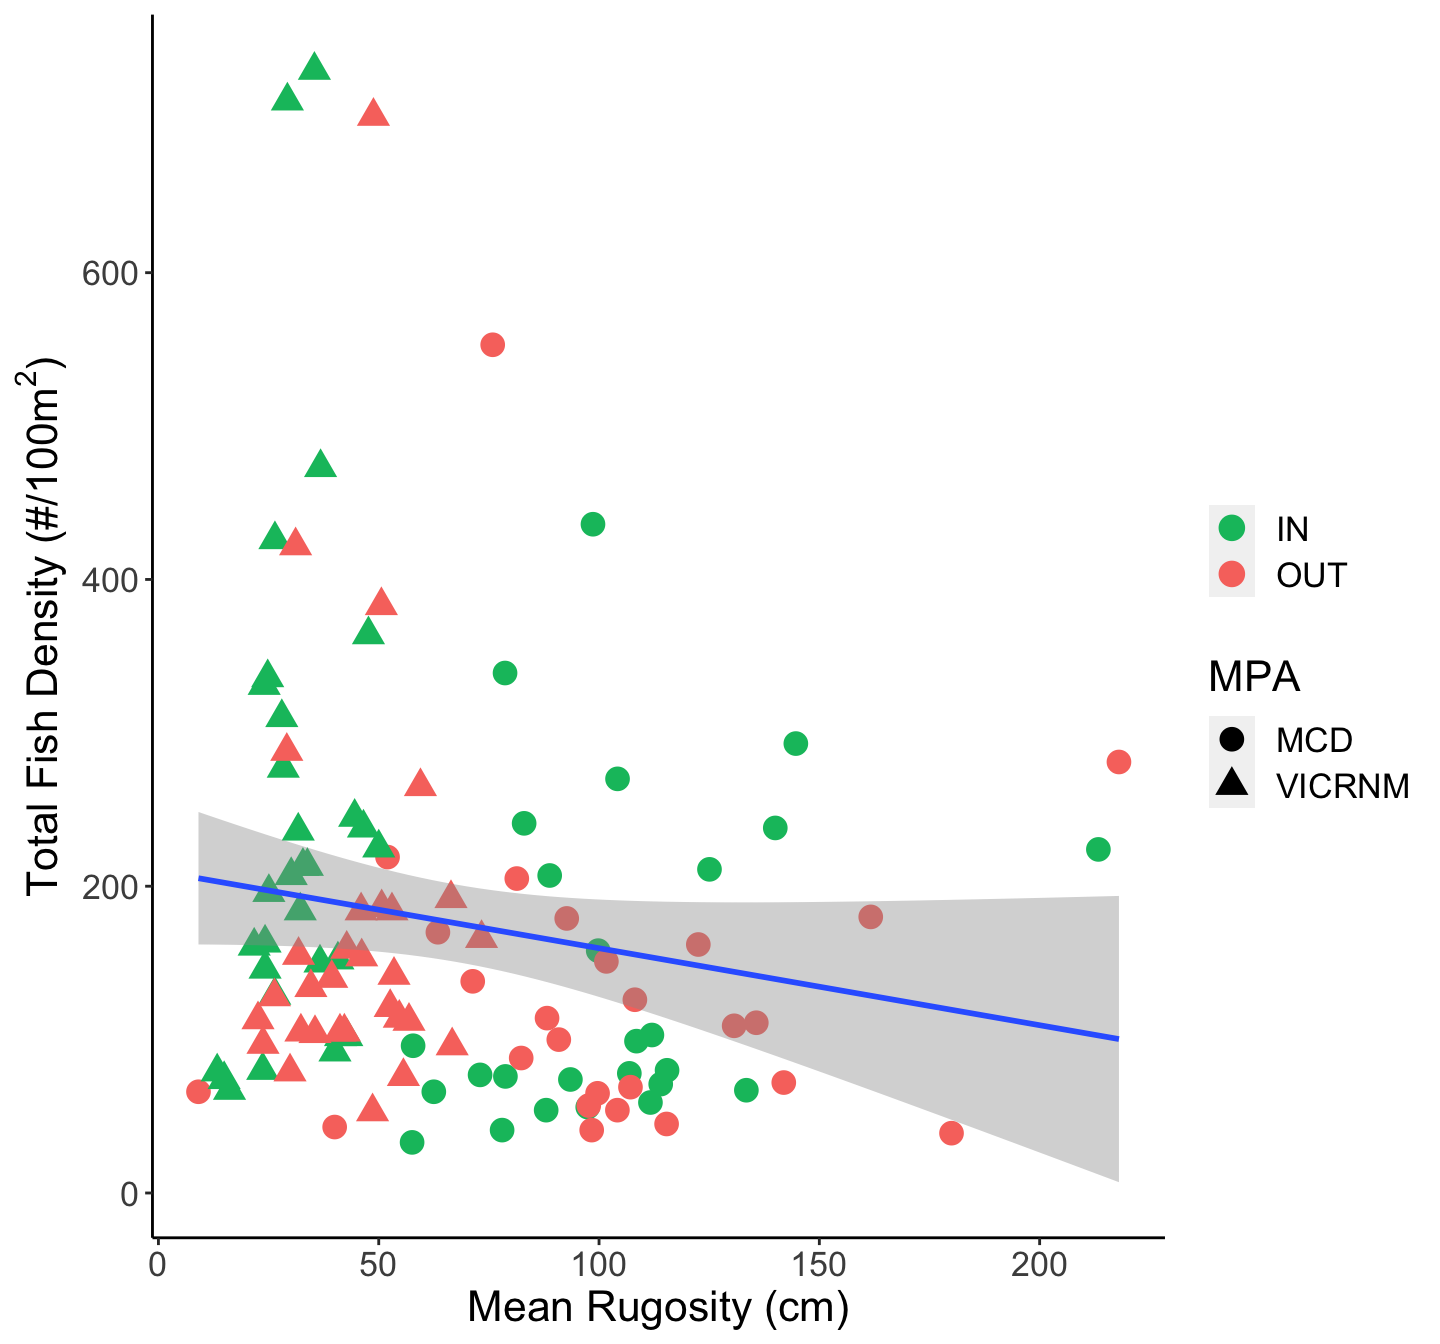
Total fish density at sites by rugosity. Shape indicates the MPA of the site, and color indicates whether the site was inside or outside the MPA.
Biomass
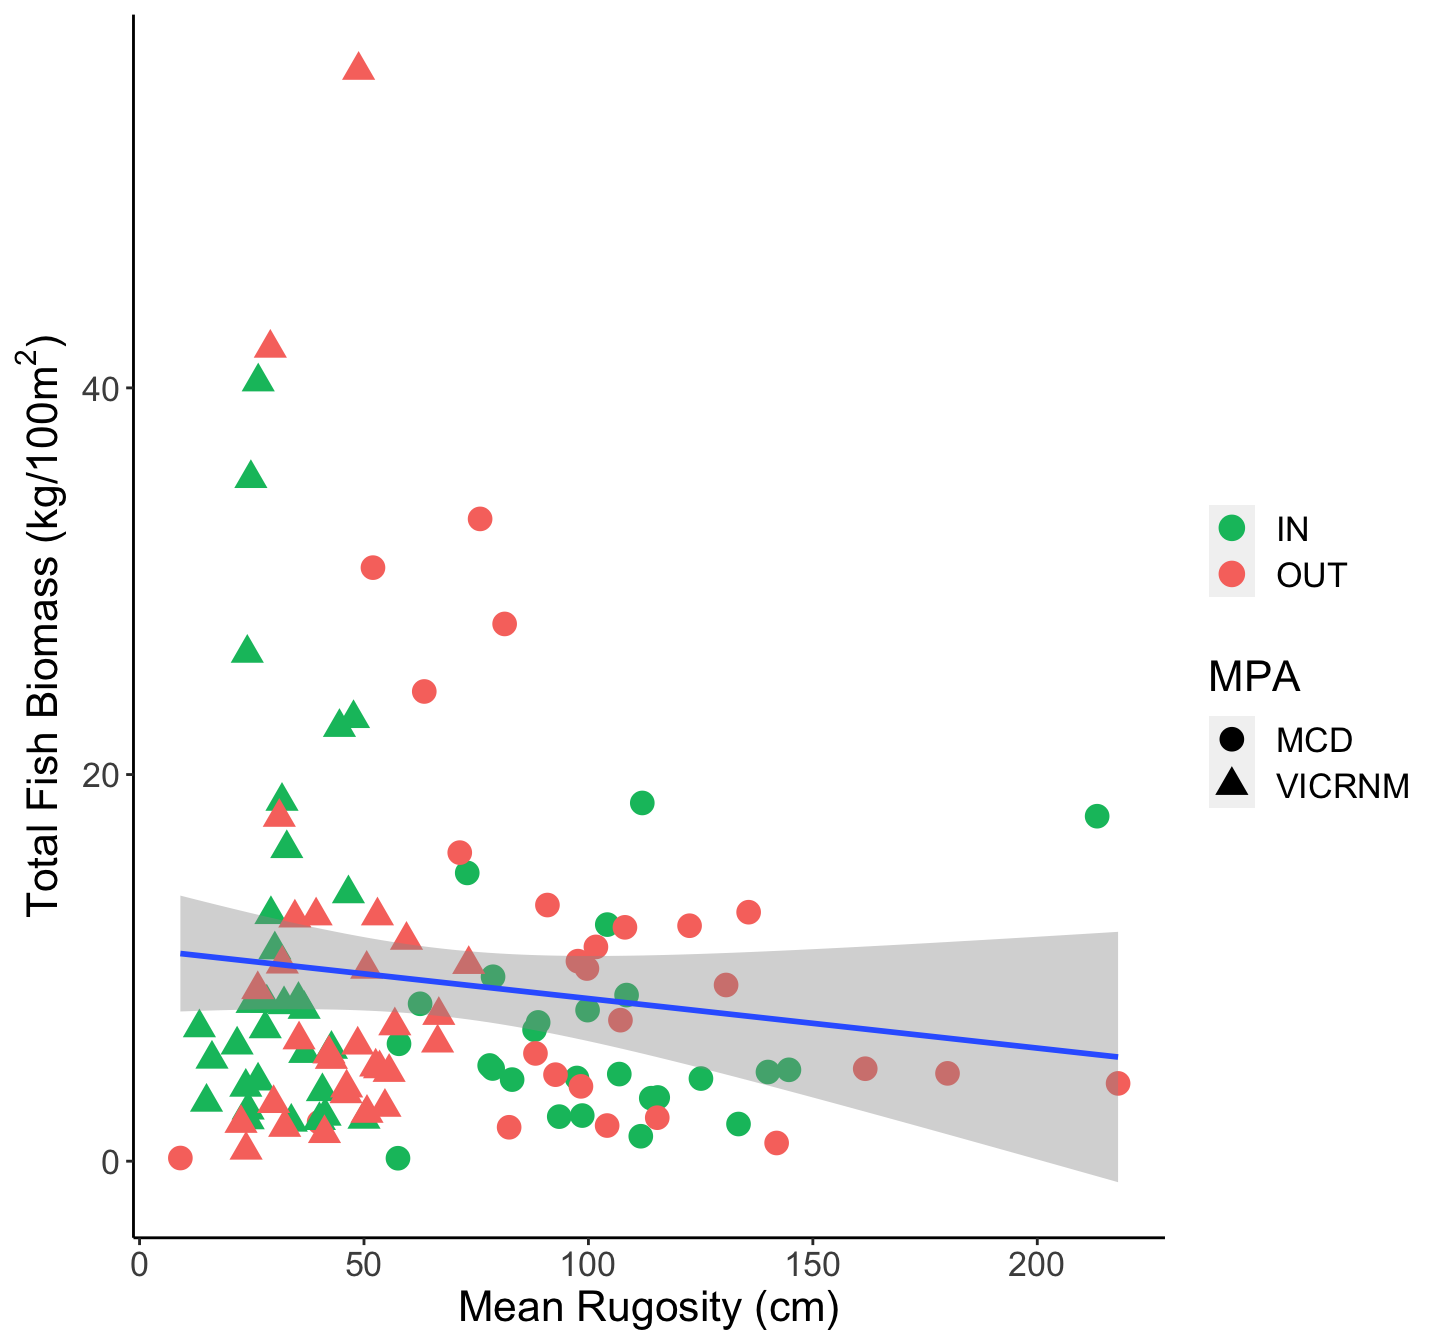
Total fish biomass at sites by rugosity. Shape indicates the MPA of the site, and color indicates whether the site was inside or outside the MPA.